Data Analysis Portfolio

Data analysis that starts
from the business question

We don't pile up data first — we start from the decision question. We interpret public and standardized data through domain context, and deliver it as visualizations, models, and handover materials that go straight into operations.

Price per pyeong across 5 Seoul districts · 10K KRW/pyeong · 24-month average
Gangnam-gu
9,890
Seocho-gu
9,402
Songpa-gu
7,230
Mapo-gu
6,122
Nowon-gu
3,274
Gangnam ↔ Nowon price per pyeong: 3.02× — same Seoul, different markets.
Source: MOLIT (Ministry of Land, Infrastructure and Transport) Real Transaction Price Open API · 39,021 records analyzed · KOGL Type 1 (Korea Open Government License — attribution; commercial use & modification permitted)
PLIC data methodology

We start from the question, not the tool. Three steps to the decision.

01

Decision framing

We start by defining what needs to be decided. In a KPI workshop, we first agree on the question and the success criteria.

Deliverables · Question brief / KPI tree
02

Analysis build

We collect and clean public and standardized data, then surface hidden patterns through domain models and dashboards.

Deliverables · Pipeline / Model / Dashboard
03

Delivery & measurement

We deliver it in a form that goes straight into decisions, measure the outcome, and carry it into the next question.

Deliverables · Handover manual / Measurement report
Case Studies
Seoul Mobility · 24h flow
6.6M trips
CASE 03 · 2026
A day in Seoul: the commute tide
Reading the city's day through Seoul Metro hourly boarding/alighting public data (OA-12252). Gangnam's morning alighting surge ↔ evening boarding reversal, three-pole concentration and a 60× gap.
Public data Mobility Retail/Location Time-axis flow
View details →
Choropleth map of price-per-pyeong gaps across 5 Seoul districts
CASE 02 · 2026
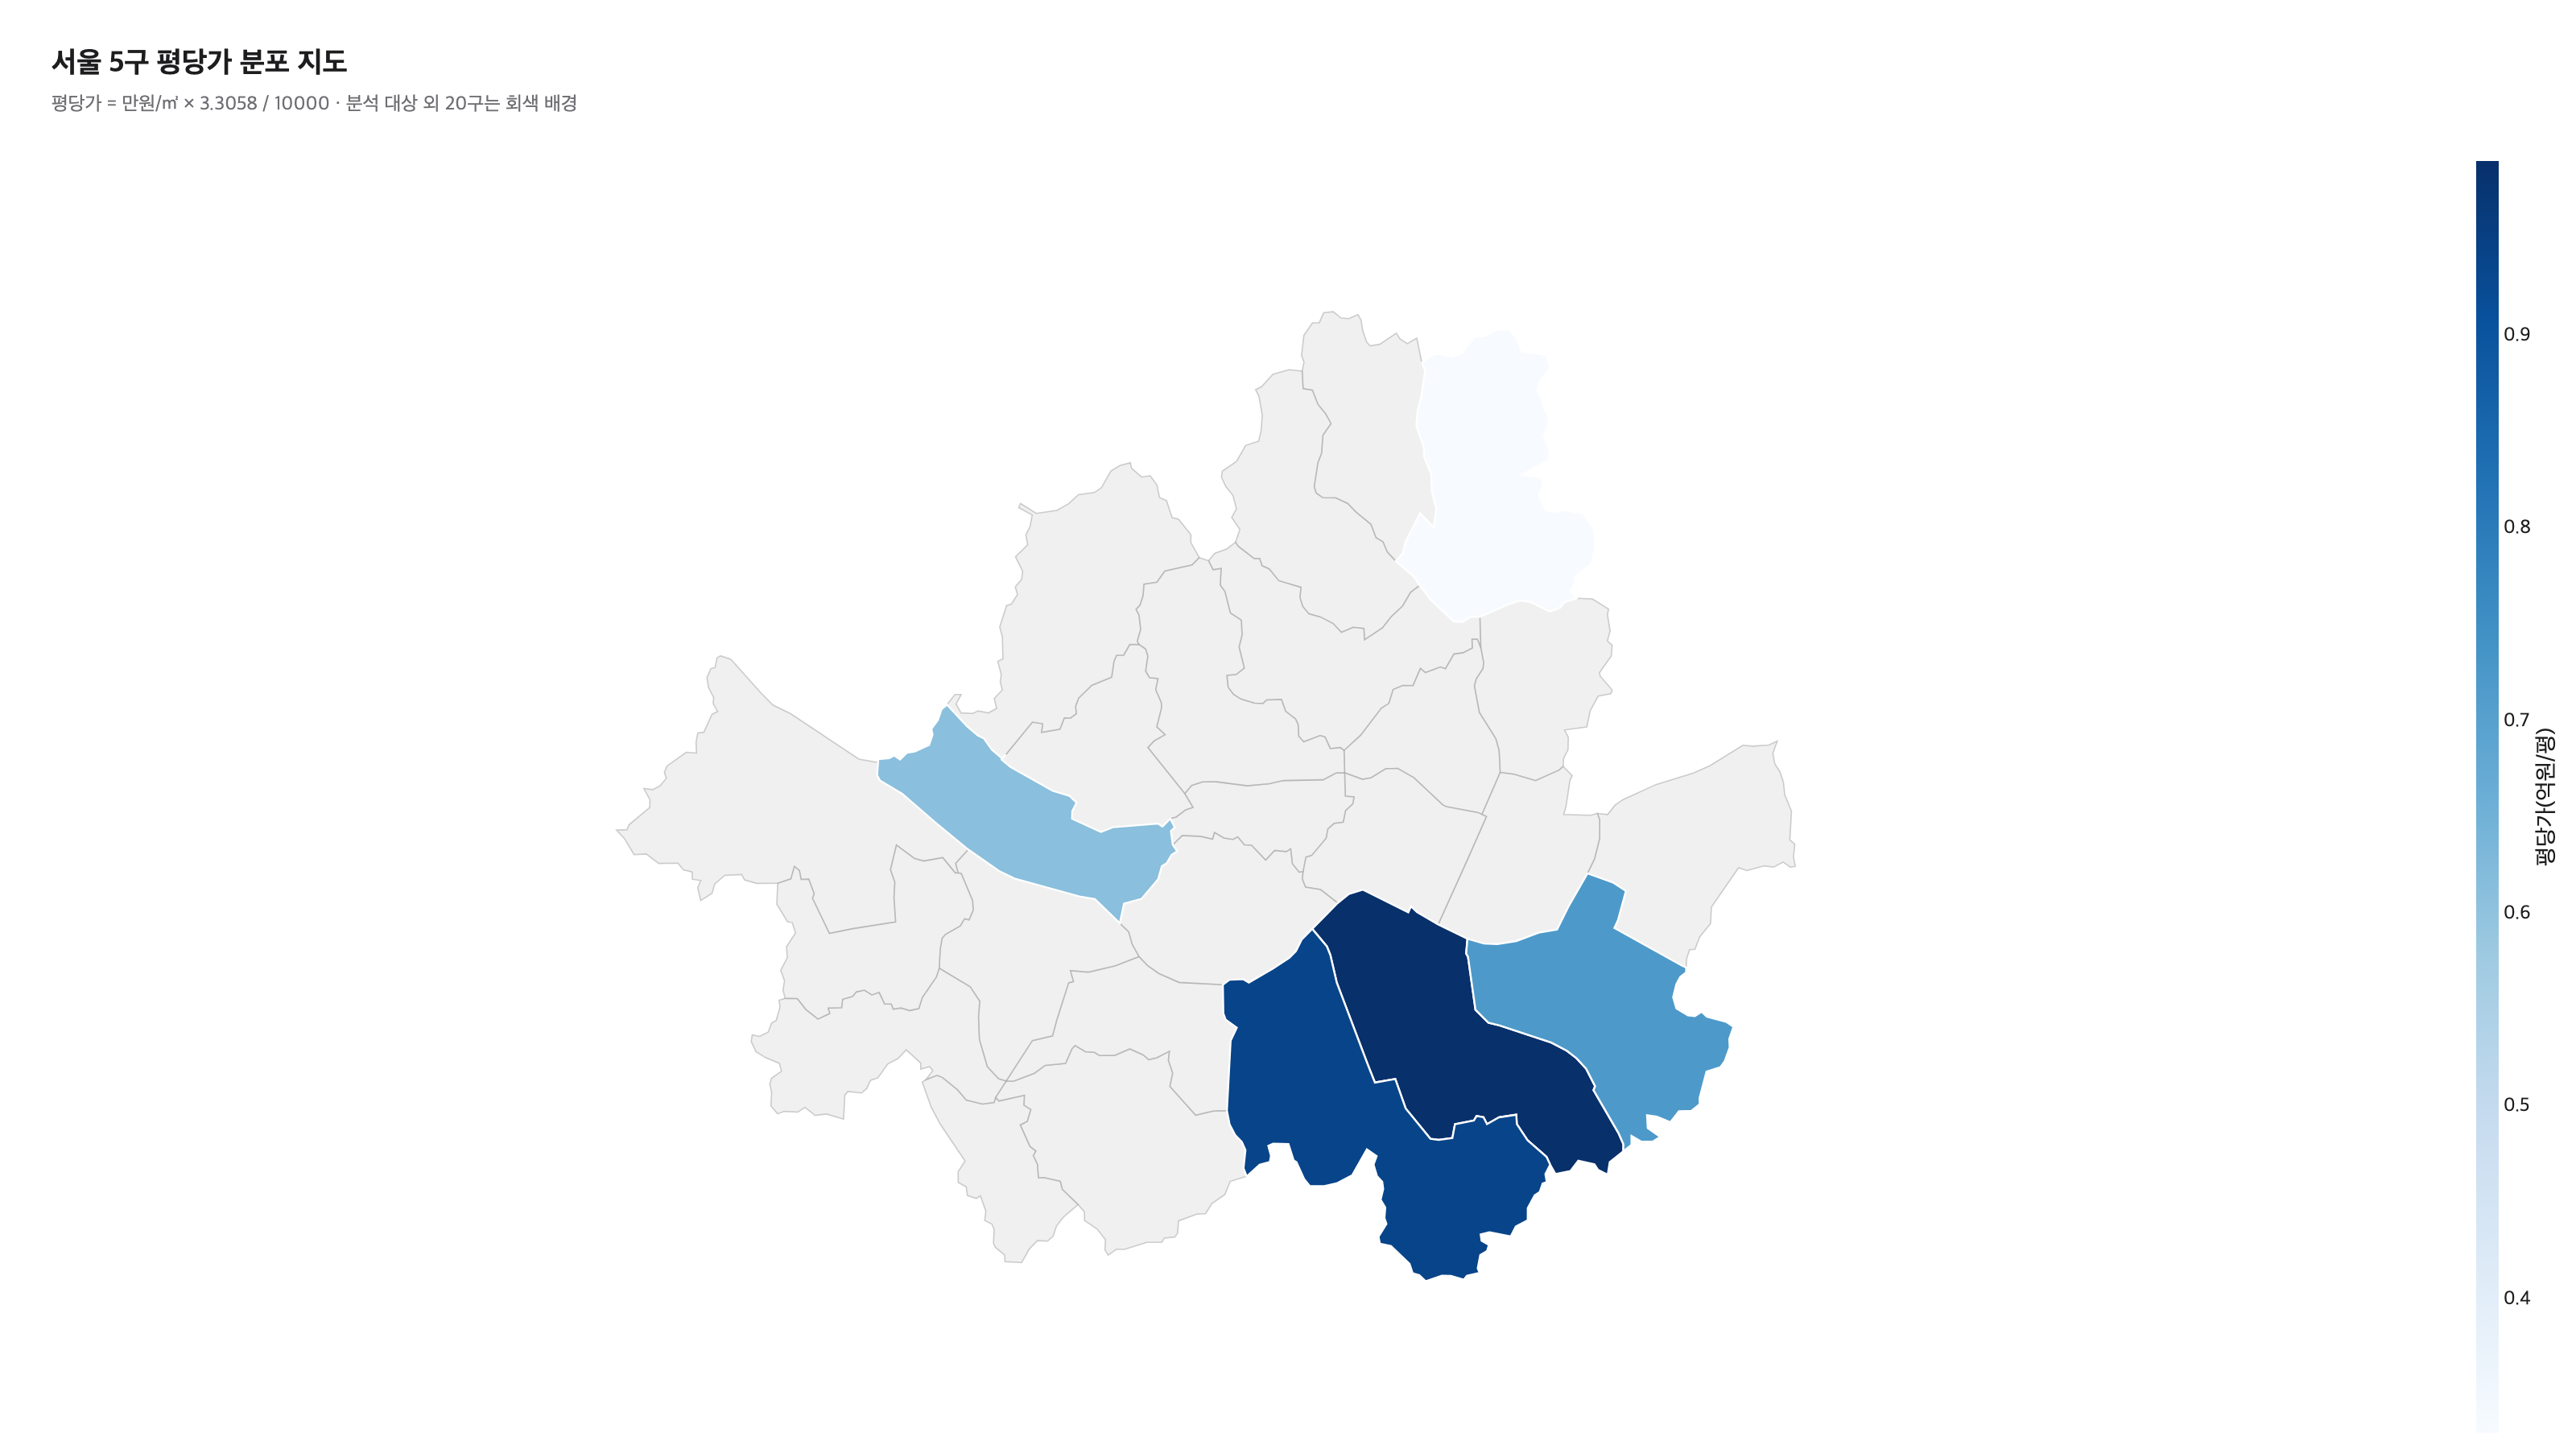
Seoul real estate transaction price operations dashboard
Analysis of 5 districts × 24 months × 39,021 transactions on MOLIT public data. Per-district quarterly models · Mapo's co-movement rise · hypothesis disproof (Nowon direct deals) · 3.02× price-per-pyeong gap.
Public data Developer IR PropTech Brokerage firm 9 charts + GIF
View details →
Global clearinghouse KPI summary
CASE 01 · 2026
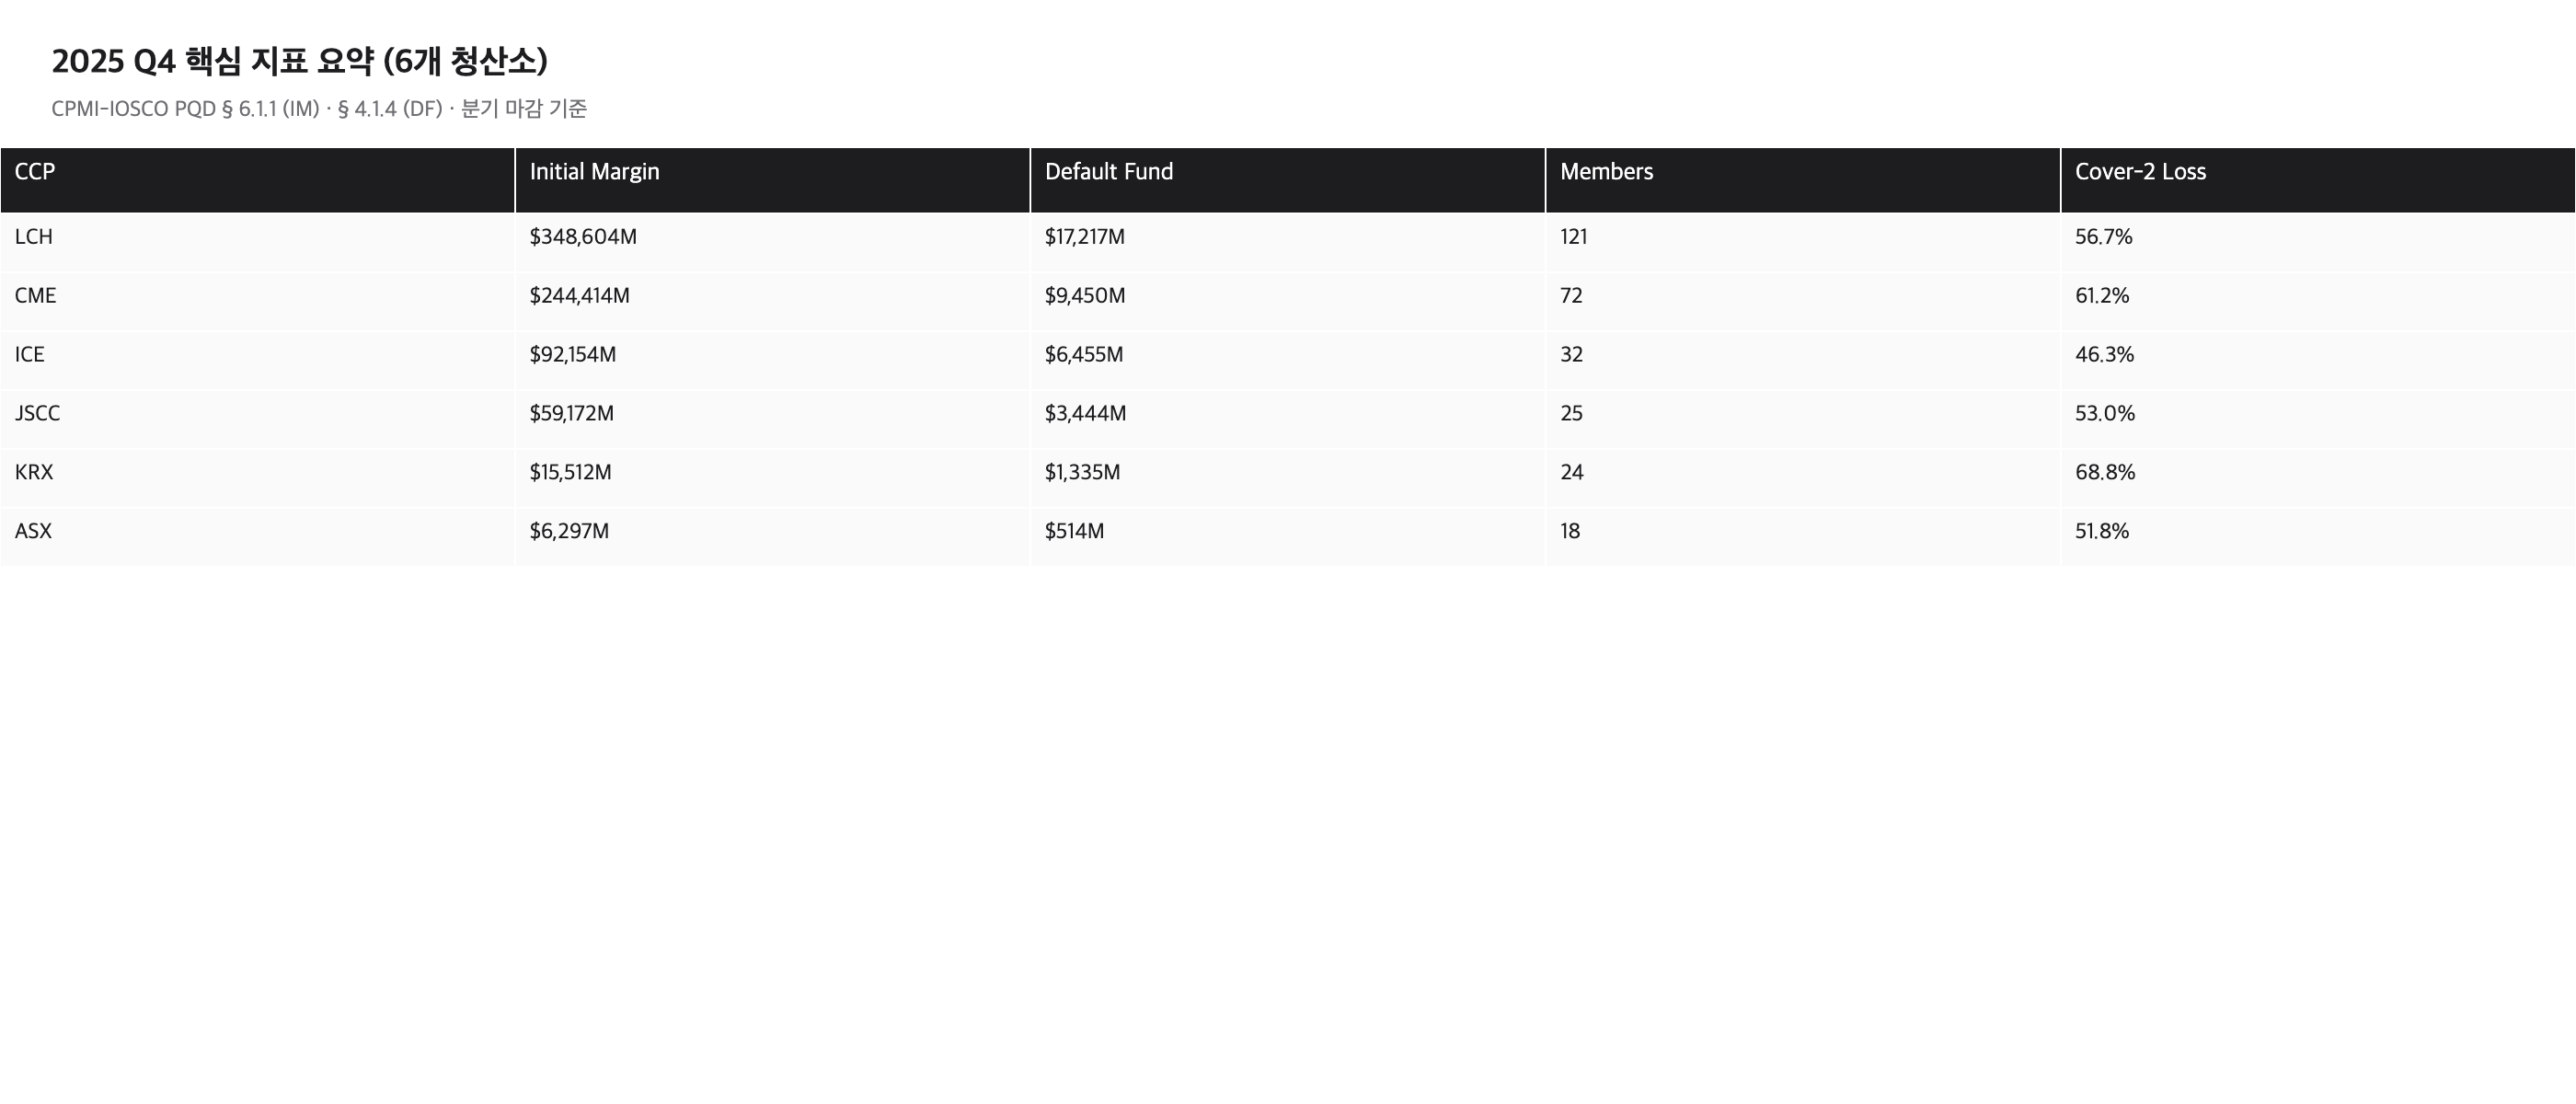
Global clearinghouse PQD comparison dashboard
A time-series comparison of 6 global clearinghouses × 12 quarters on the CPMI-IOSCO PQD standard. Cross-CCP stress co-movement · own-capital commitment · member clearing flows.
Financial infrastructure Clearing & settlement Risk management 8 charts + GIF
View details →
Upcoming
Case studies in progress: healthcare statistics · education statistics · small-business trade areas
If there's a domain you'd like to work on together, reach out at [email protected].