PLIC Studio · Case Study 01 · Global Clearinghouse PQD

Decision questions — Where do we stand within the global benchmark? Are there any anomalies?
This case study starts from the two questions raised in a clearinghouse quarterly review meeting.

Translating international
disclosure standards into KRX operational judgment.

CPMI-IOSCO PQD standards (the Public Quantitative Disclosure standards jointly issued by CPMI of the Bank for International Settlements and IOSCO) across 6 global clearinghouses × 12 quarters of time-series comparison + function library pattern + handoff manual for non-specialists. Validated for an in-house LAN deployment scenario with 50 concurrent users on a Python · Streamlit · Plotly stack.

※ This case study is a portfolio demo based on standard-conformant synthetic data (see § 2 Data & Methodology for details).

6
global clearinghouses
(CME · LCH · ICE · JSCC · ASX · KRX)
12
quarters (2023 Q1 ~ 2025 Q4)
3-year time series
14
core PQD quantitative metrics
(Margin · Default · Activity · Risk)
8
interactive charts
+ business insights
Python 3.13 Streamlit Plotly Polars DuckDB CPMI-IOSCO PQD
§ 2. Data & Methodology

CPMI-IOSCO standard conformance + market-event stress modeling

Clearinghouse disclosure data is standardized on the Public Quantitative Disclosure Standards issued by CPMI-IOSCO in 2015. This case study uses synthetic data conformant to the standard column structure, modeling real market events (banking crises · monetary policy shifts · trade policy) as stress multipliers to reproduce a realistic distribution.

📊 14 selected PQD metrics

  • § Margin: Initial Margin · Peak Intra-day Call (largest additional margin called during the day)
  • § Default Resources: Default Fund (mutualised fund) · Skin-in-the-game (SITG, the CCP's own capital absorbing losses) · Total Prefunded
  • § Activity: Notional Cleared · Clearing Members (number of clearing member firms)
  • § Risk: Cover-2 (stress test assuming the simultaneous default of the two largest members) · Largest Exposure · Available Liquidity
  • § Meta: CCP code · name · region · quarter

🌐 Market-event stress model

  • 2023 Q1: SVB · Credit Suisse crisis (×1.15)
  • 2024 Q1: BOJ YCC exit (×1.08)
  • 2024 Q3: yen carry-trade unwind / August Nikkei sell-off (×1.06)
  • 2024 Q4: US election uncertainty (×1.12)
  • 2025 Q1: tariff shock / trade policy (×1.18)
  • 2025 Q4: residual volatility (×1.09 — gradual normalization after the Q1 tariff shock)

PLIC Data Methodology

Standard → analysis → operational judgment. The 3 steps this case followed.

Starting from international disclosure standards as a common language, we connected them to decision-support material for KRX operational meetings.

01 · FRAMING

Decision framing

Defining the "benchmark position · anomaly check" questions from the perspectives of quarterly review meetings · member firm briefings · board reporting.

02 · BUILD

Analysis build

CPMI-IOSCO PQD standard-conformant synthetic data + market-event stress model + 8 interactive charts.

03 · DELIVER

Delivery & measurement

KRX operational-context interpretation + function library handoff + in-house LAN deployment scenario.


§ 3. Analysis & Visualisation

8 charts · 8 business insights

Each chart pairs a data observation with a KRX operational-context interpretation. (≈ 30 seconds per chart · about 5 minutes total)

CHART C1

Initial Margin time-series comparison

6 clearinghouses × 12 quarters · CPMI-IOSCO PQD § 6.1.1
C1 Initial Margin trend
▶ Insight C1

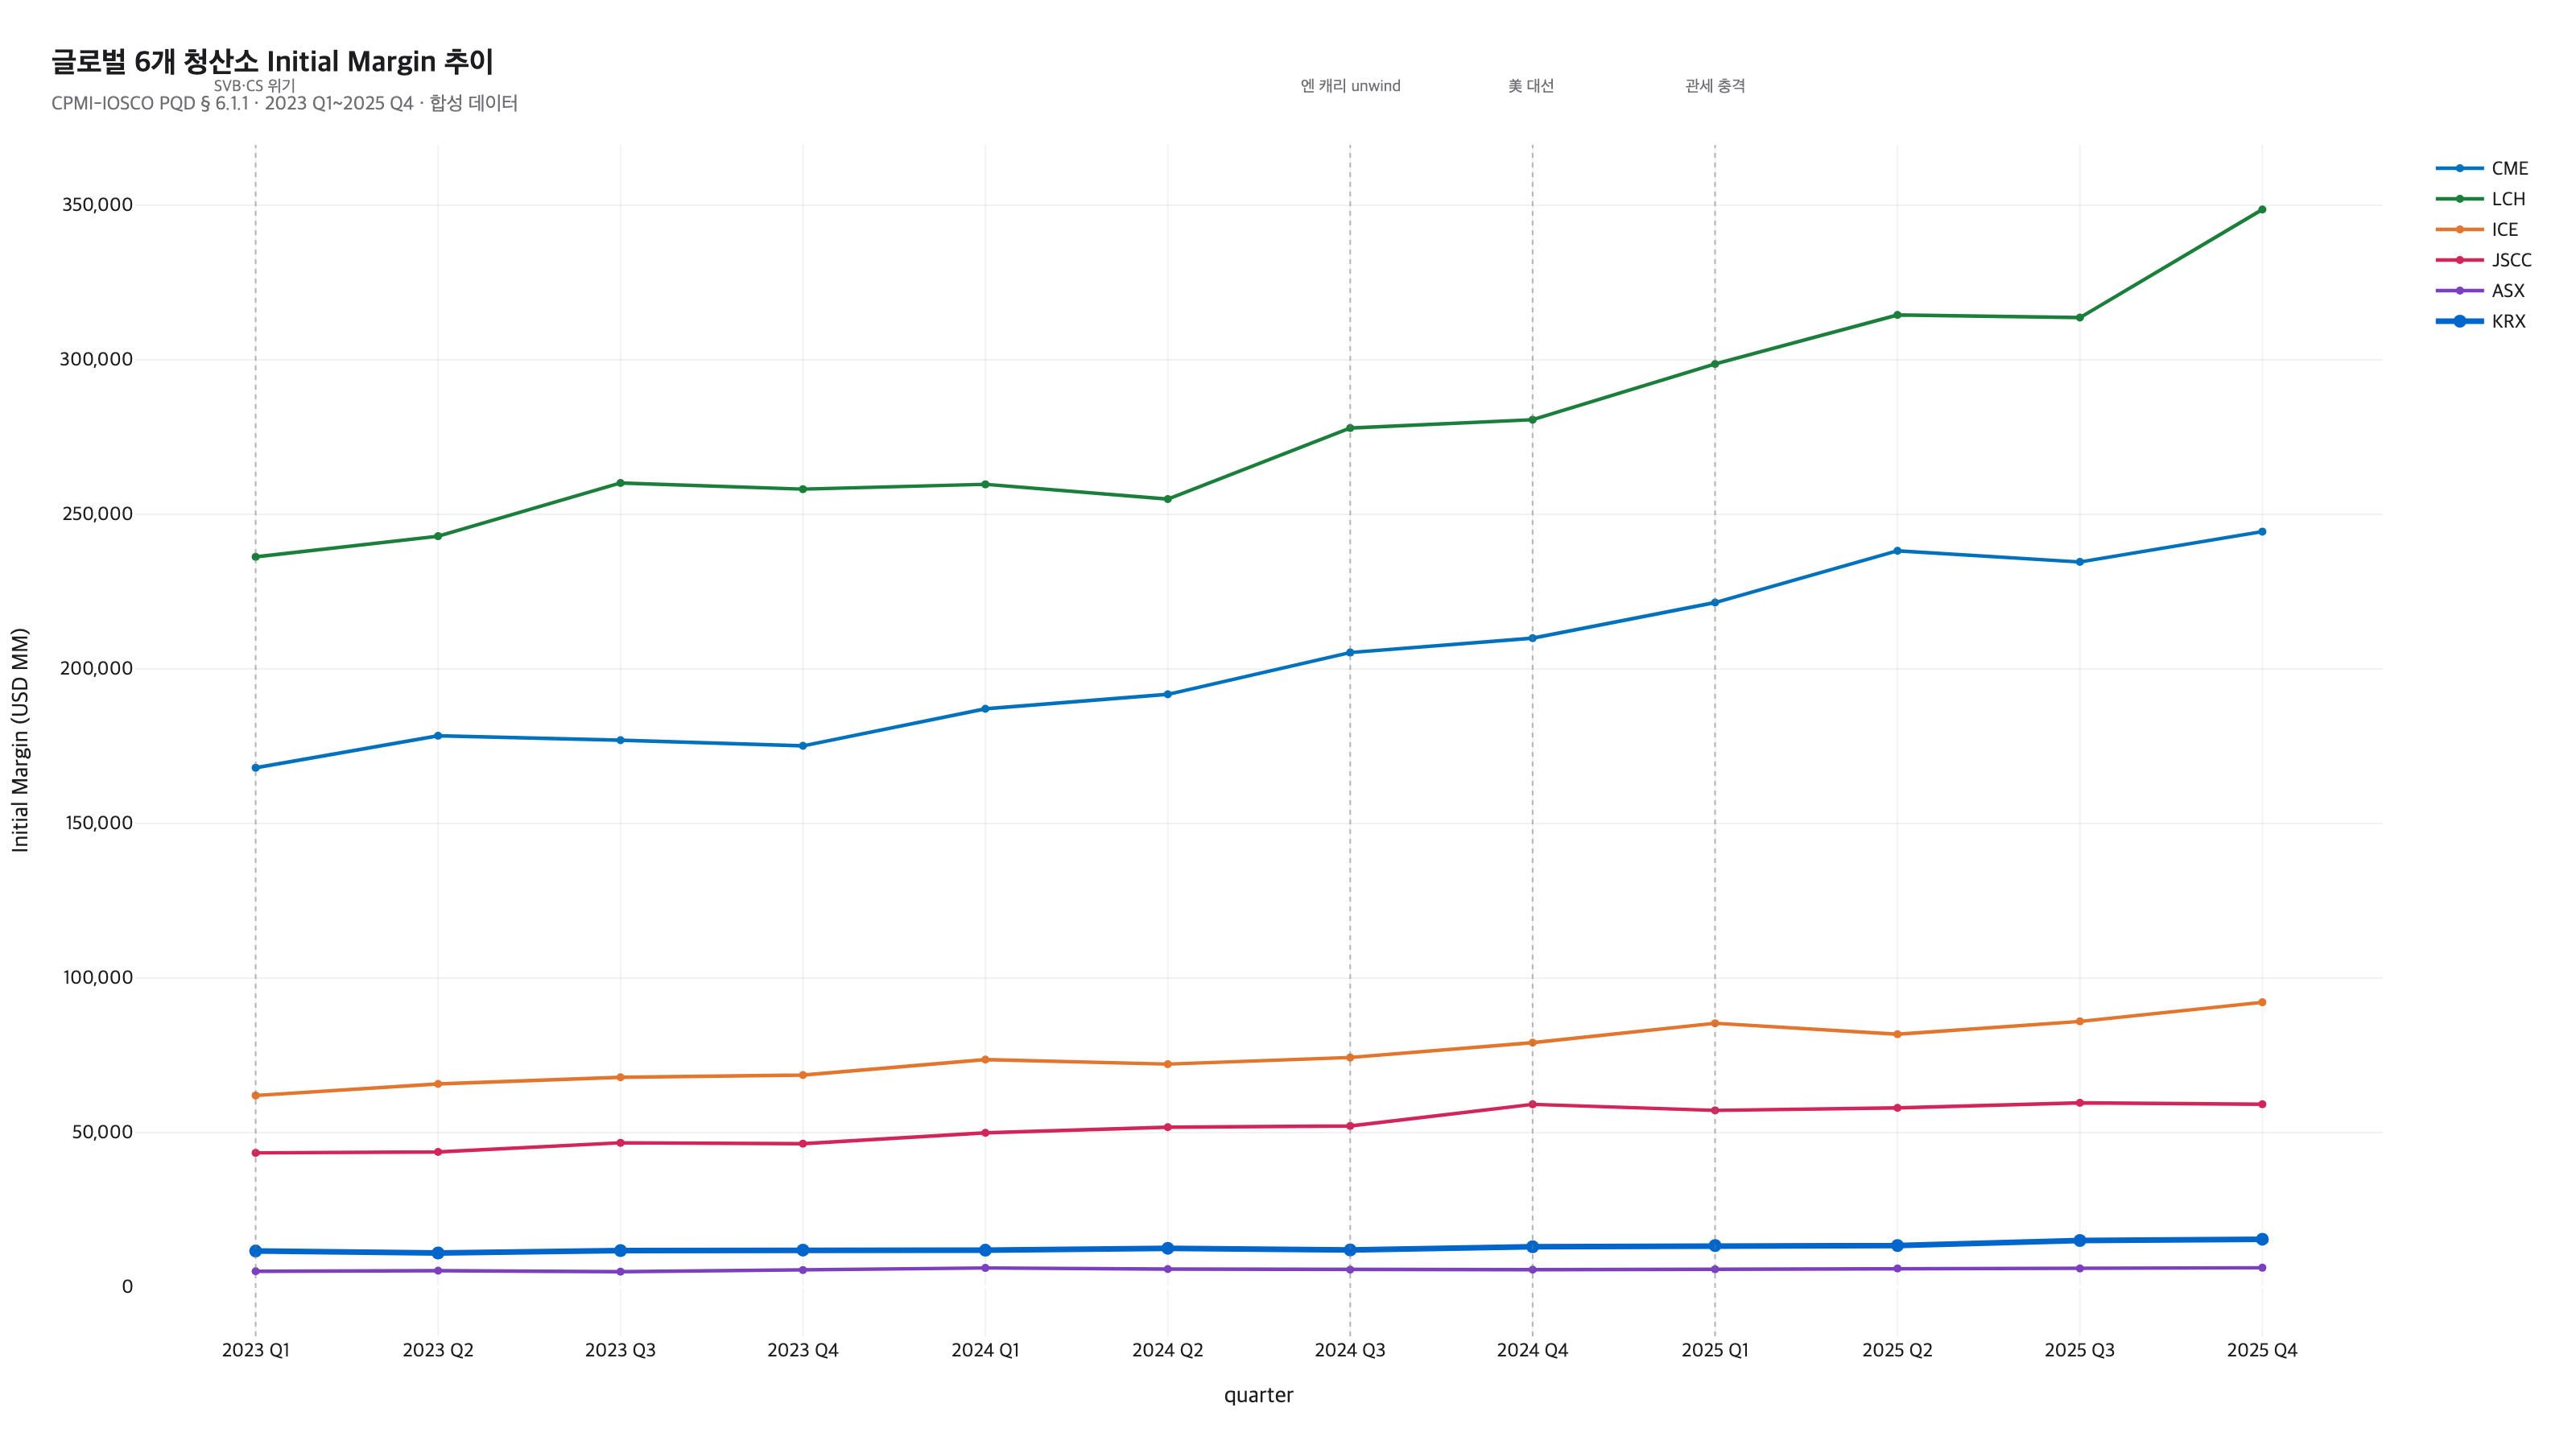
In the 2025 Q1 tariff-shock quarter, margins rose simultaneously — ICE +7.9% · LCH +6.4% · CME +5.5% · KRX +2.9% · ASX +2.0%, a spike at 5 of 6 clearinghouses. Only JSCC was an exception at -3.3%.

Applied to KRX: Trade-policy swings such as a tariff shock affect EMEA · Americas · APAC at the same time. Member firms exposed to markets outside Korea should secure margin calls and liquidity ahead of quarters where a macro event occurs.

CHART C2

2025 Q4 clearinghouse size ranking

By Initial Margin · quarter-end snapshot
C2 size ranking
▶ Insight C2

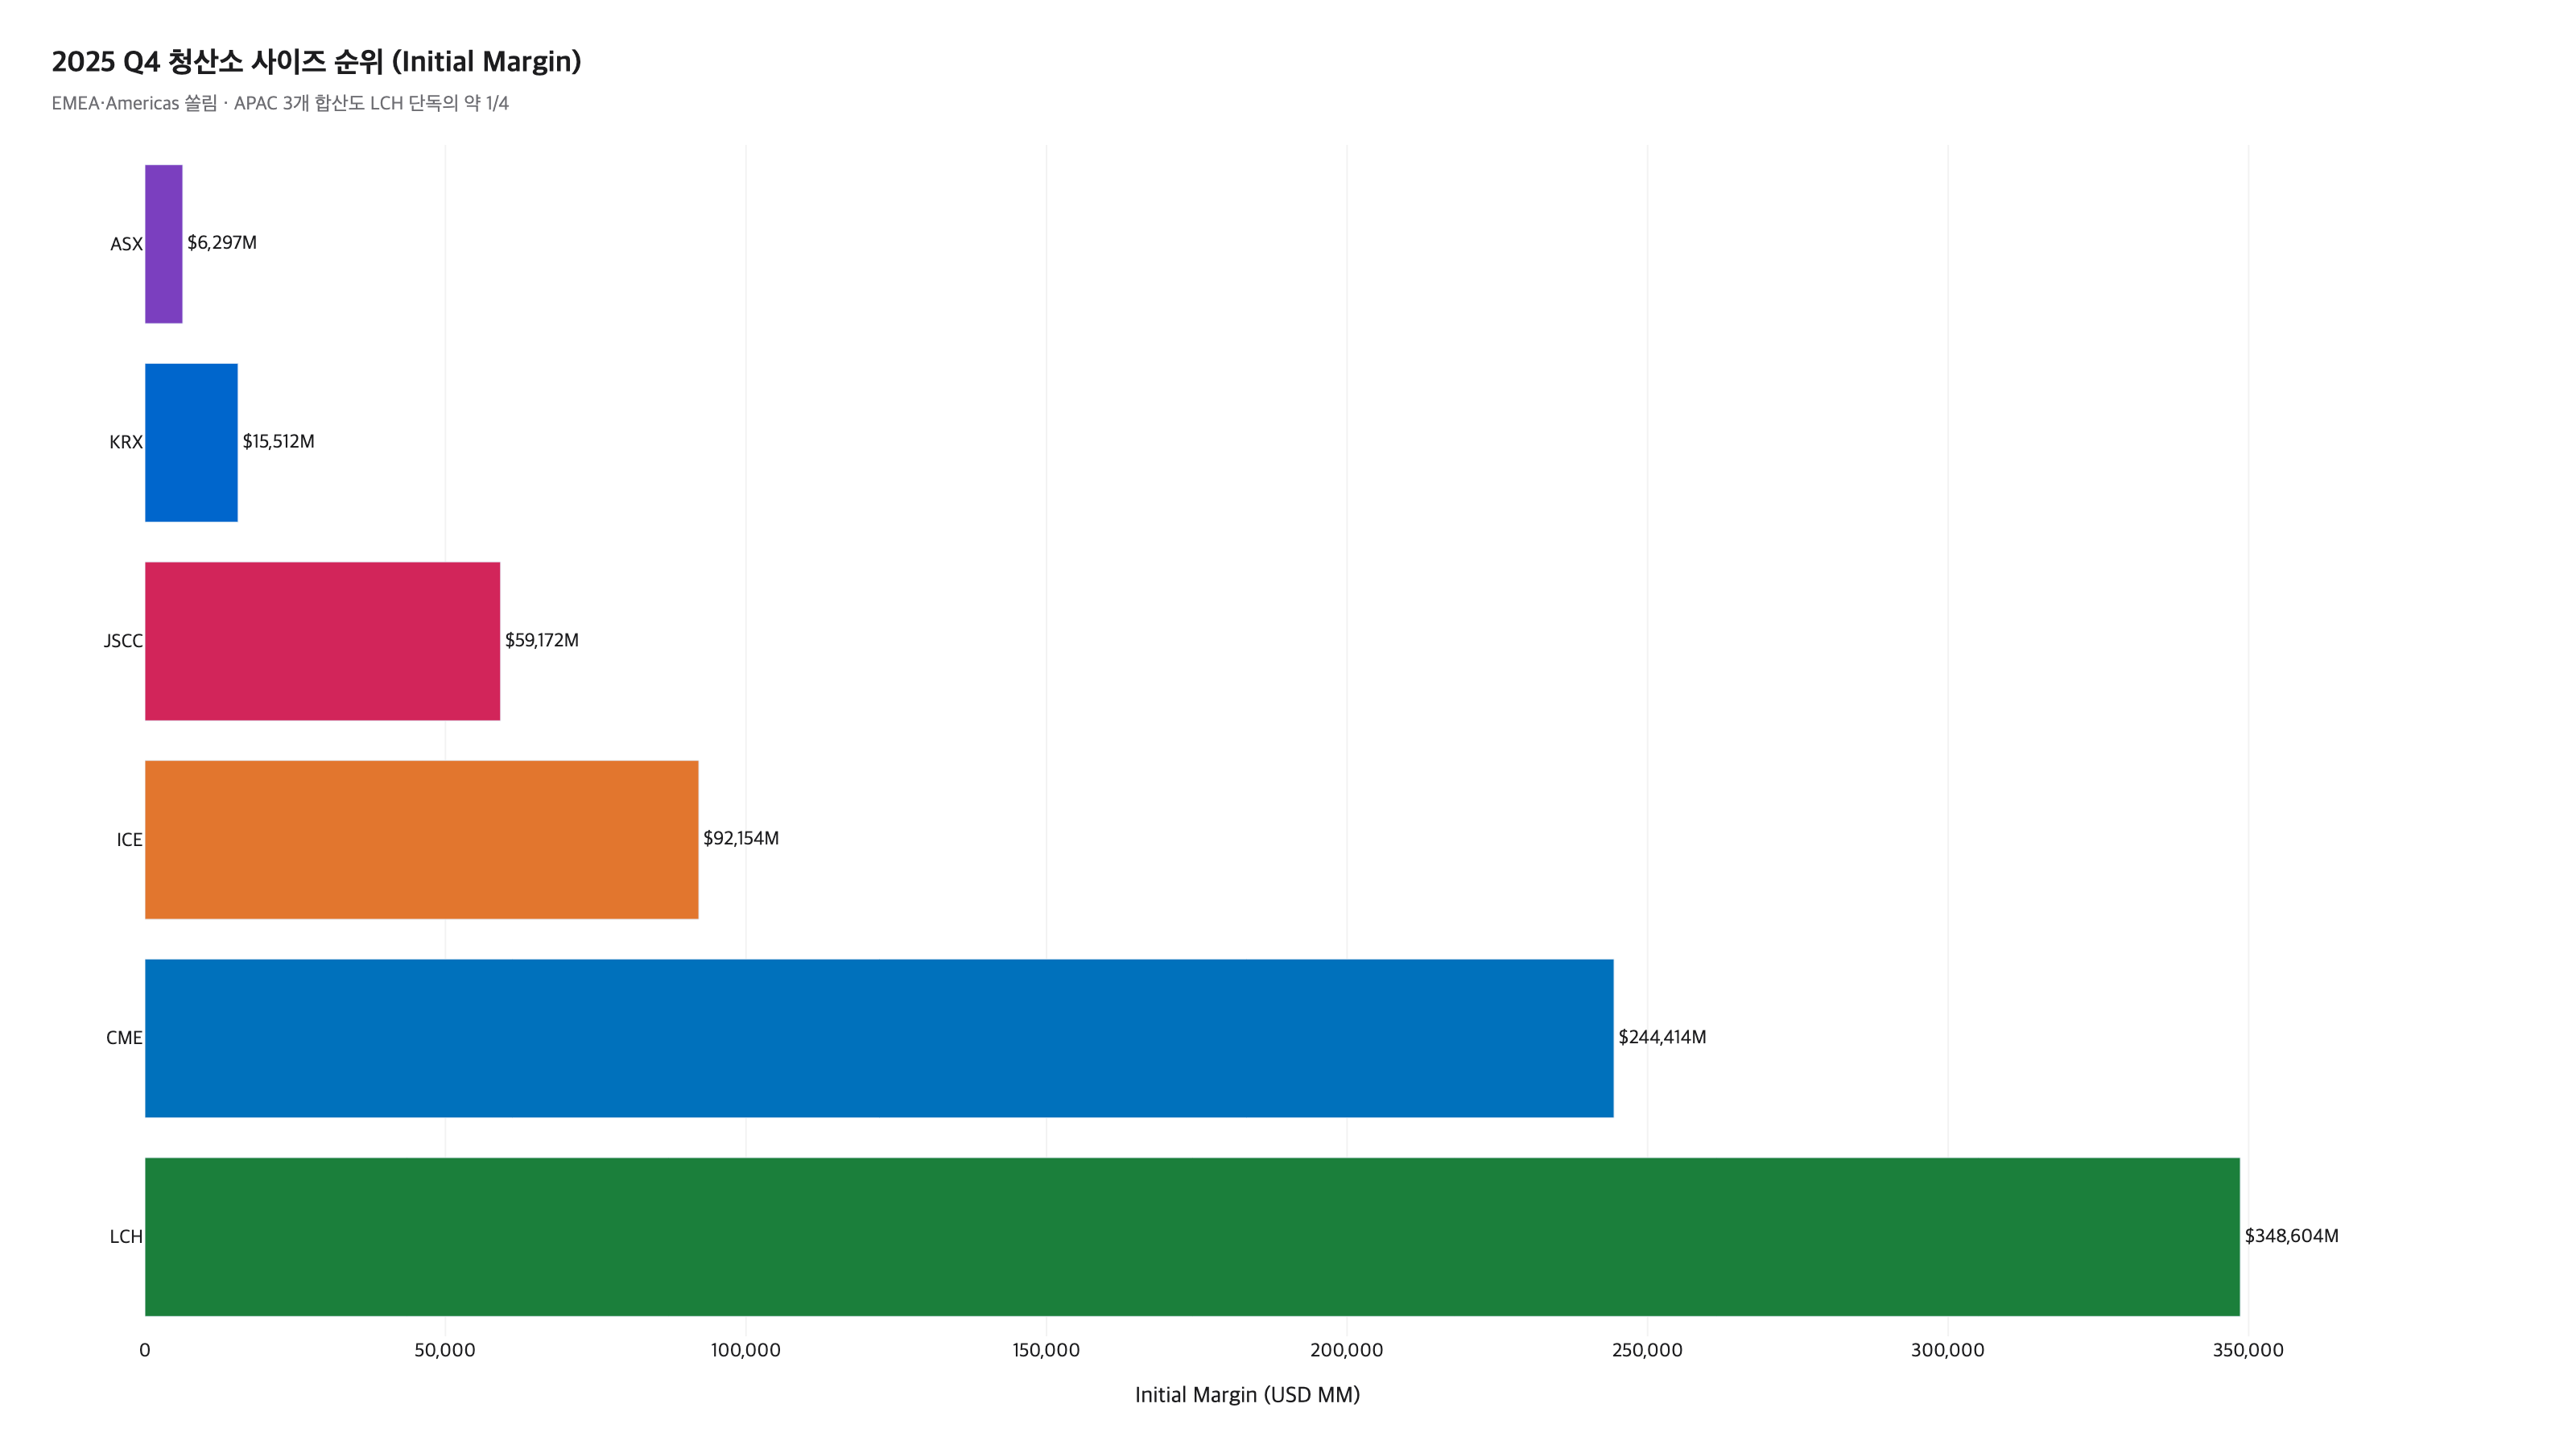
LCH ($349B) > CME ($244B) > ICE ($92B) > JSCC ($59B) > KRX ($16B) > ASX ($6B). EMEA (LCH alone) > Americas (CME+ICE = $336B) > APAC 3 combined ($81B) — a clear concentration in EMEA · Americas. Even the APAC total is roughly one quarter of LCH alone.

Regional comparison: Global clearing infrastructure is concentrated in EMEA · Americas. The APAC trio combined is still about one quarter the size of LCH alone — to anchor KRX operational decisions on top of this size gap, information sharing among clearinghouses in the same region carries significant value.

CHART C3

Peak Intra-day / IM Ratio heatmap (Cross-CCP stress synchronization)

Higher values indicate a within-quarter volatility spike · 1.8x or above = clear stress
C3 stress heatmap
▶ Insight C3

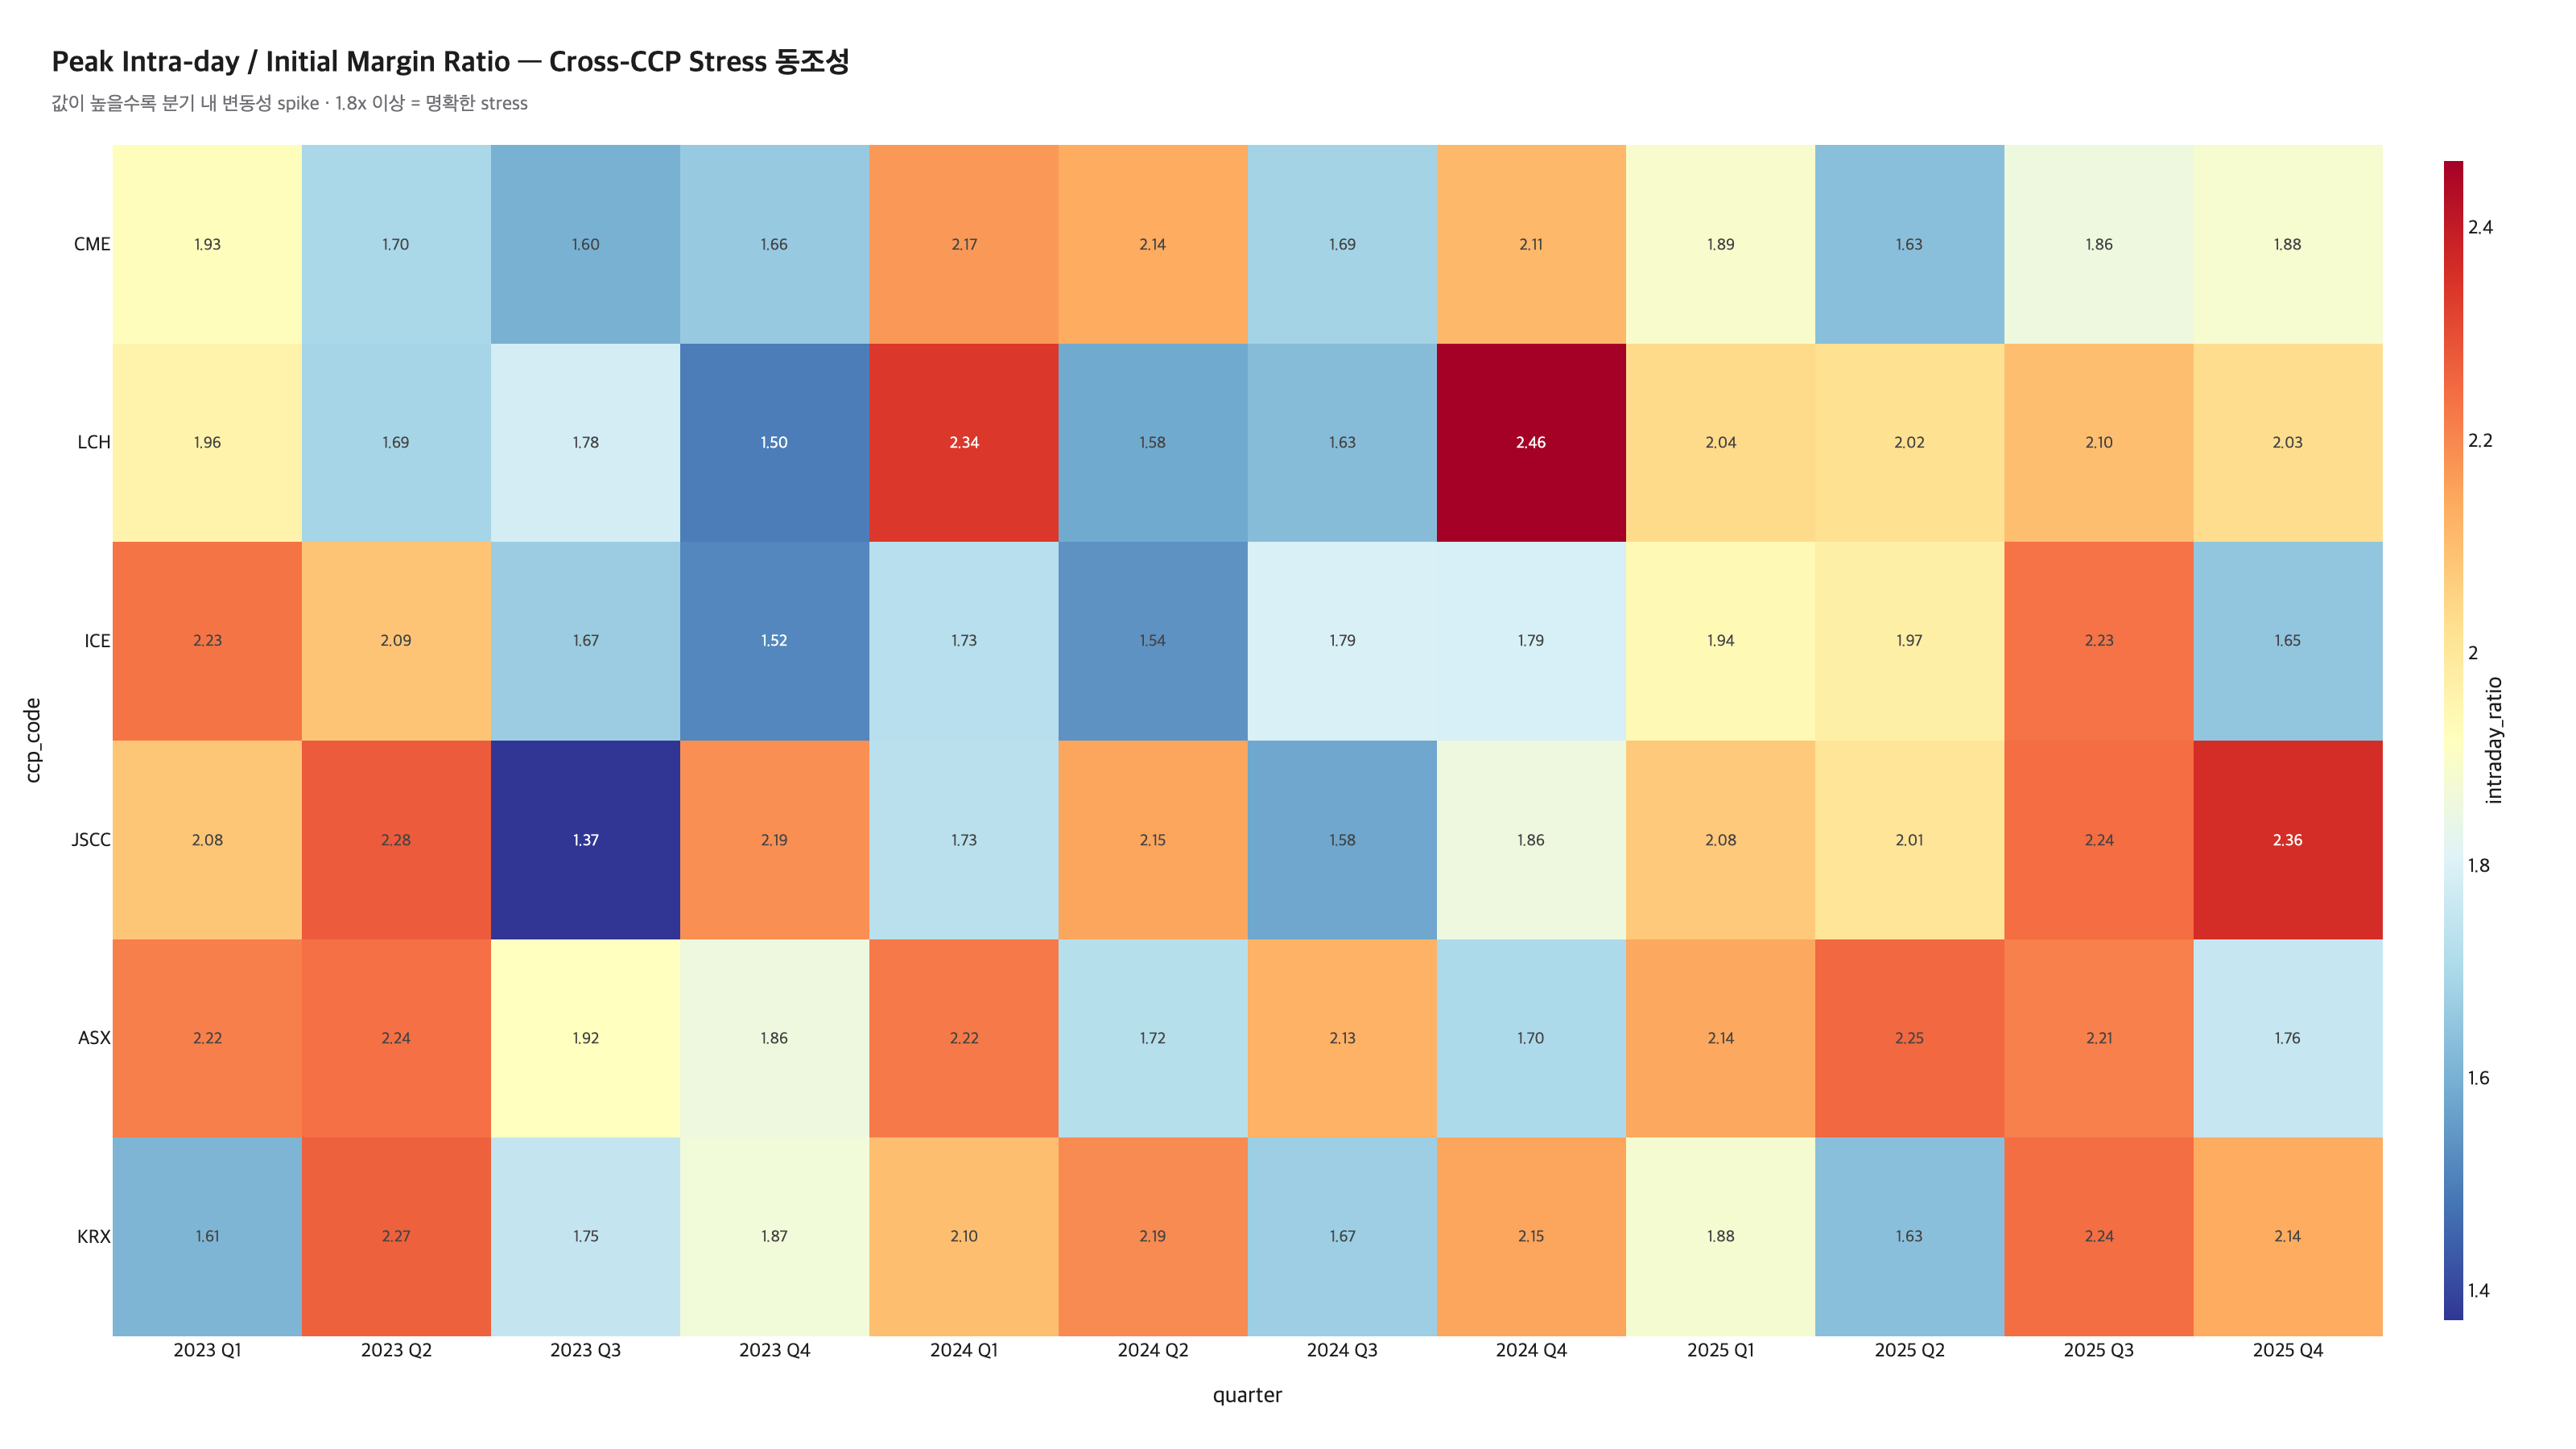
In two quarters, 2025 Q1 and 2025 Q3, all 6 of 6 clearinghouses hit a ratio of 1.8x+ at once. 2023 Q1 (SVB) 5/6, 2024 Q1 (BOJ) 4/6, 2024 Q4 (US election) 4/6 show partial synchronization. Non-stress quarters stay around 1/6.

Reporting flow: Distinguishing whether a value spiked at a single clearinghouse or whether several CCPs moved together in the same quarter changes the internal reporting threshold. When a simultaneous spike is detected, it can be classified not as a single clearinghouse's transient move but as a macro-environment shift, and escalated for separate analysis and executive reporting.

CHART C4

2025 Q4 Prefunded Resources composition (Sunburst)

Region → CCP → Resource Type hierarchical visualization
C4 resources sunburst
▶ Insight C4

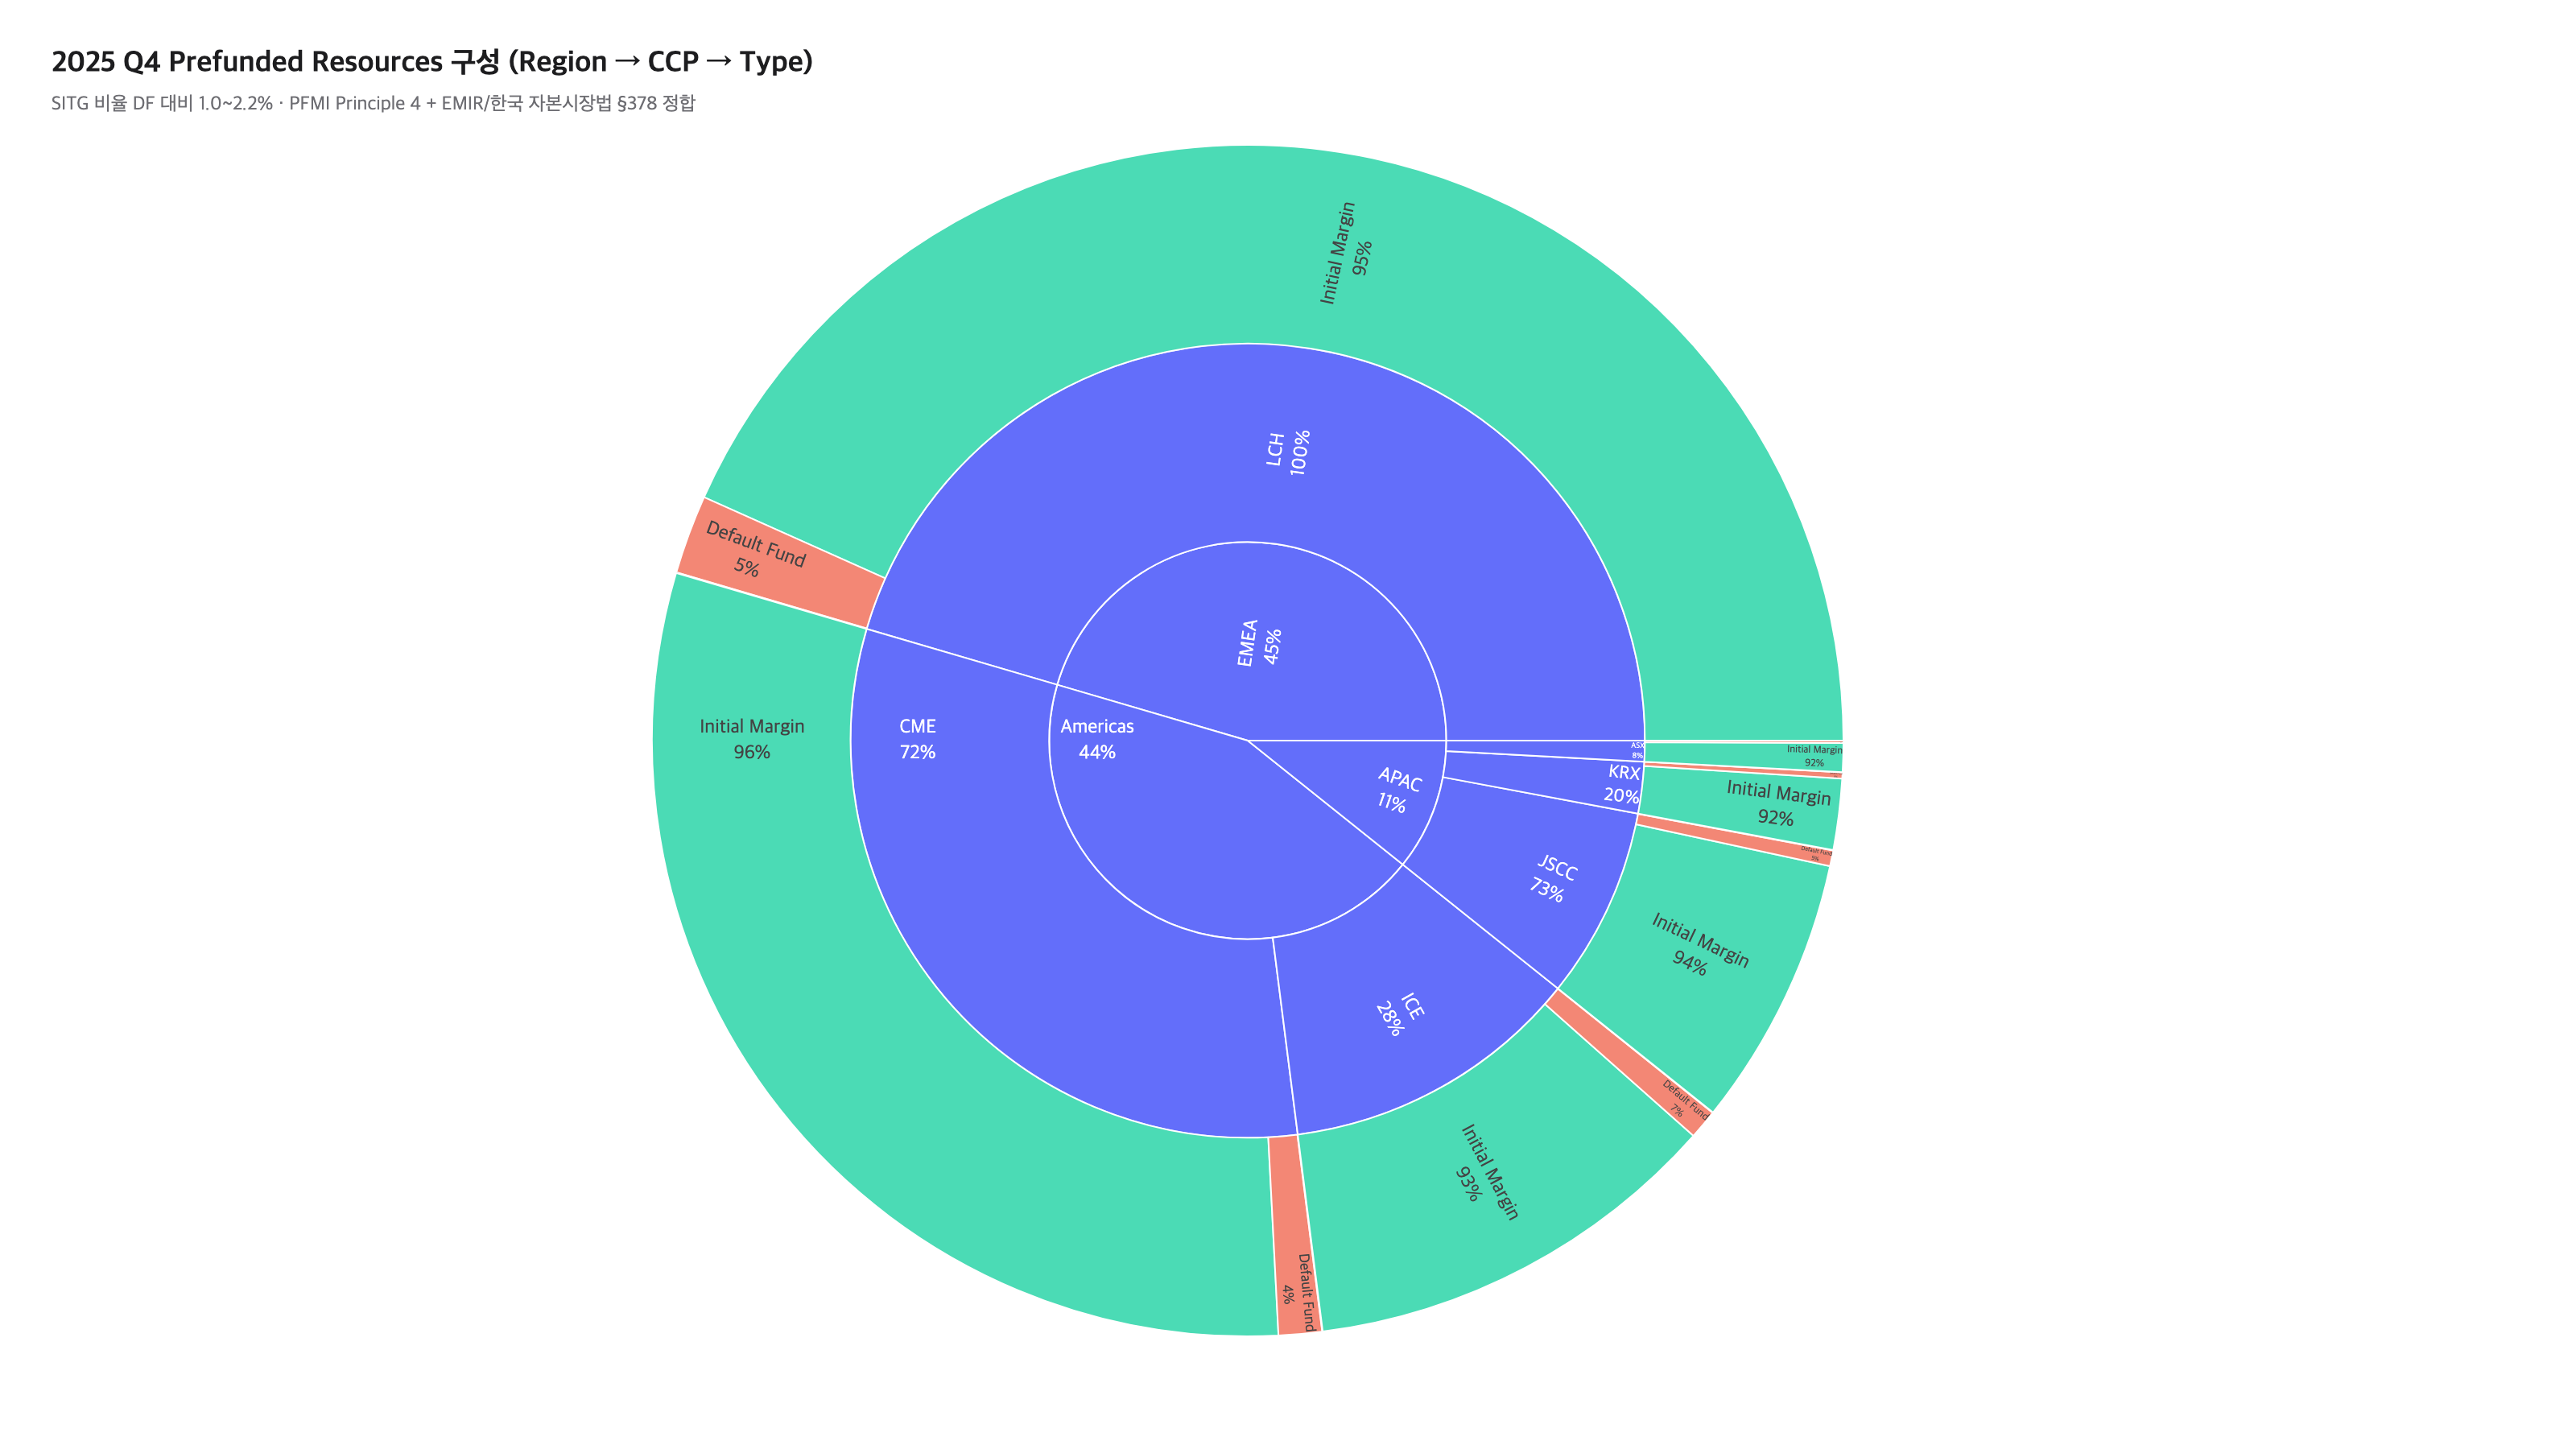
Initial Margin accounts for 91.9–96.2% of prefunded resources (95.2% combined). Default Fund is 4–9% of IM, and SITG (skin-in-the-game) is 1.0–2.2% of the Default Fund. KRX's SITG ratio is 2.2% (vs DF) — higher than the synthetic-data average (1.6%).

Member firm briefing: This is a structure conformant to PFMI Principle 4 + CPMI-IOSCO PQD § 4.1.4 (EU CCPs additionally apply the ≥25% RTS under Commission Delegated Regulation 153/2013 Article 35 · Korea applies the Financial Investment Services and Capital Markets Act §378 + the FSC's Clearing and Settlement Business Regulation separately). SITG sits in the default waterfall after the defaulting member's own resources are exhausted first, and its position relative to the mutualised DF diverges by CCP — e.g., KRX moved SITG ahead of the mutualised DF through the 2015 amendment to the Capital Markets Act (in the wake of the 2013 HanMag incident). It serves as supporting material when explaining to member firms that the CCP is directly committing its own capital to the loss-absorption order.

CHART C5

Cover-2 Stress Loss distribution (12-quarter box plot)

Distribution width = volatility exposure · narrow = stable operation
C5 cover2 box plot
▶ Insight C5

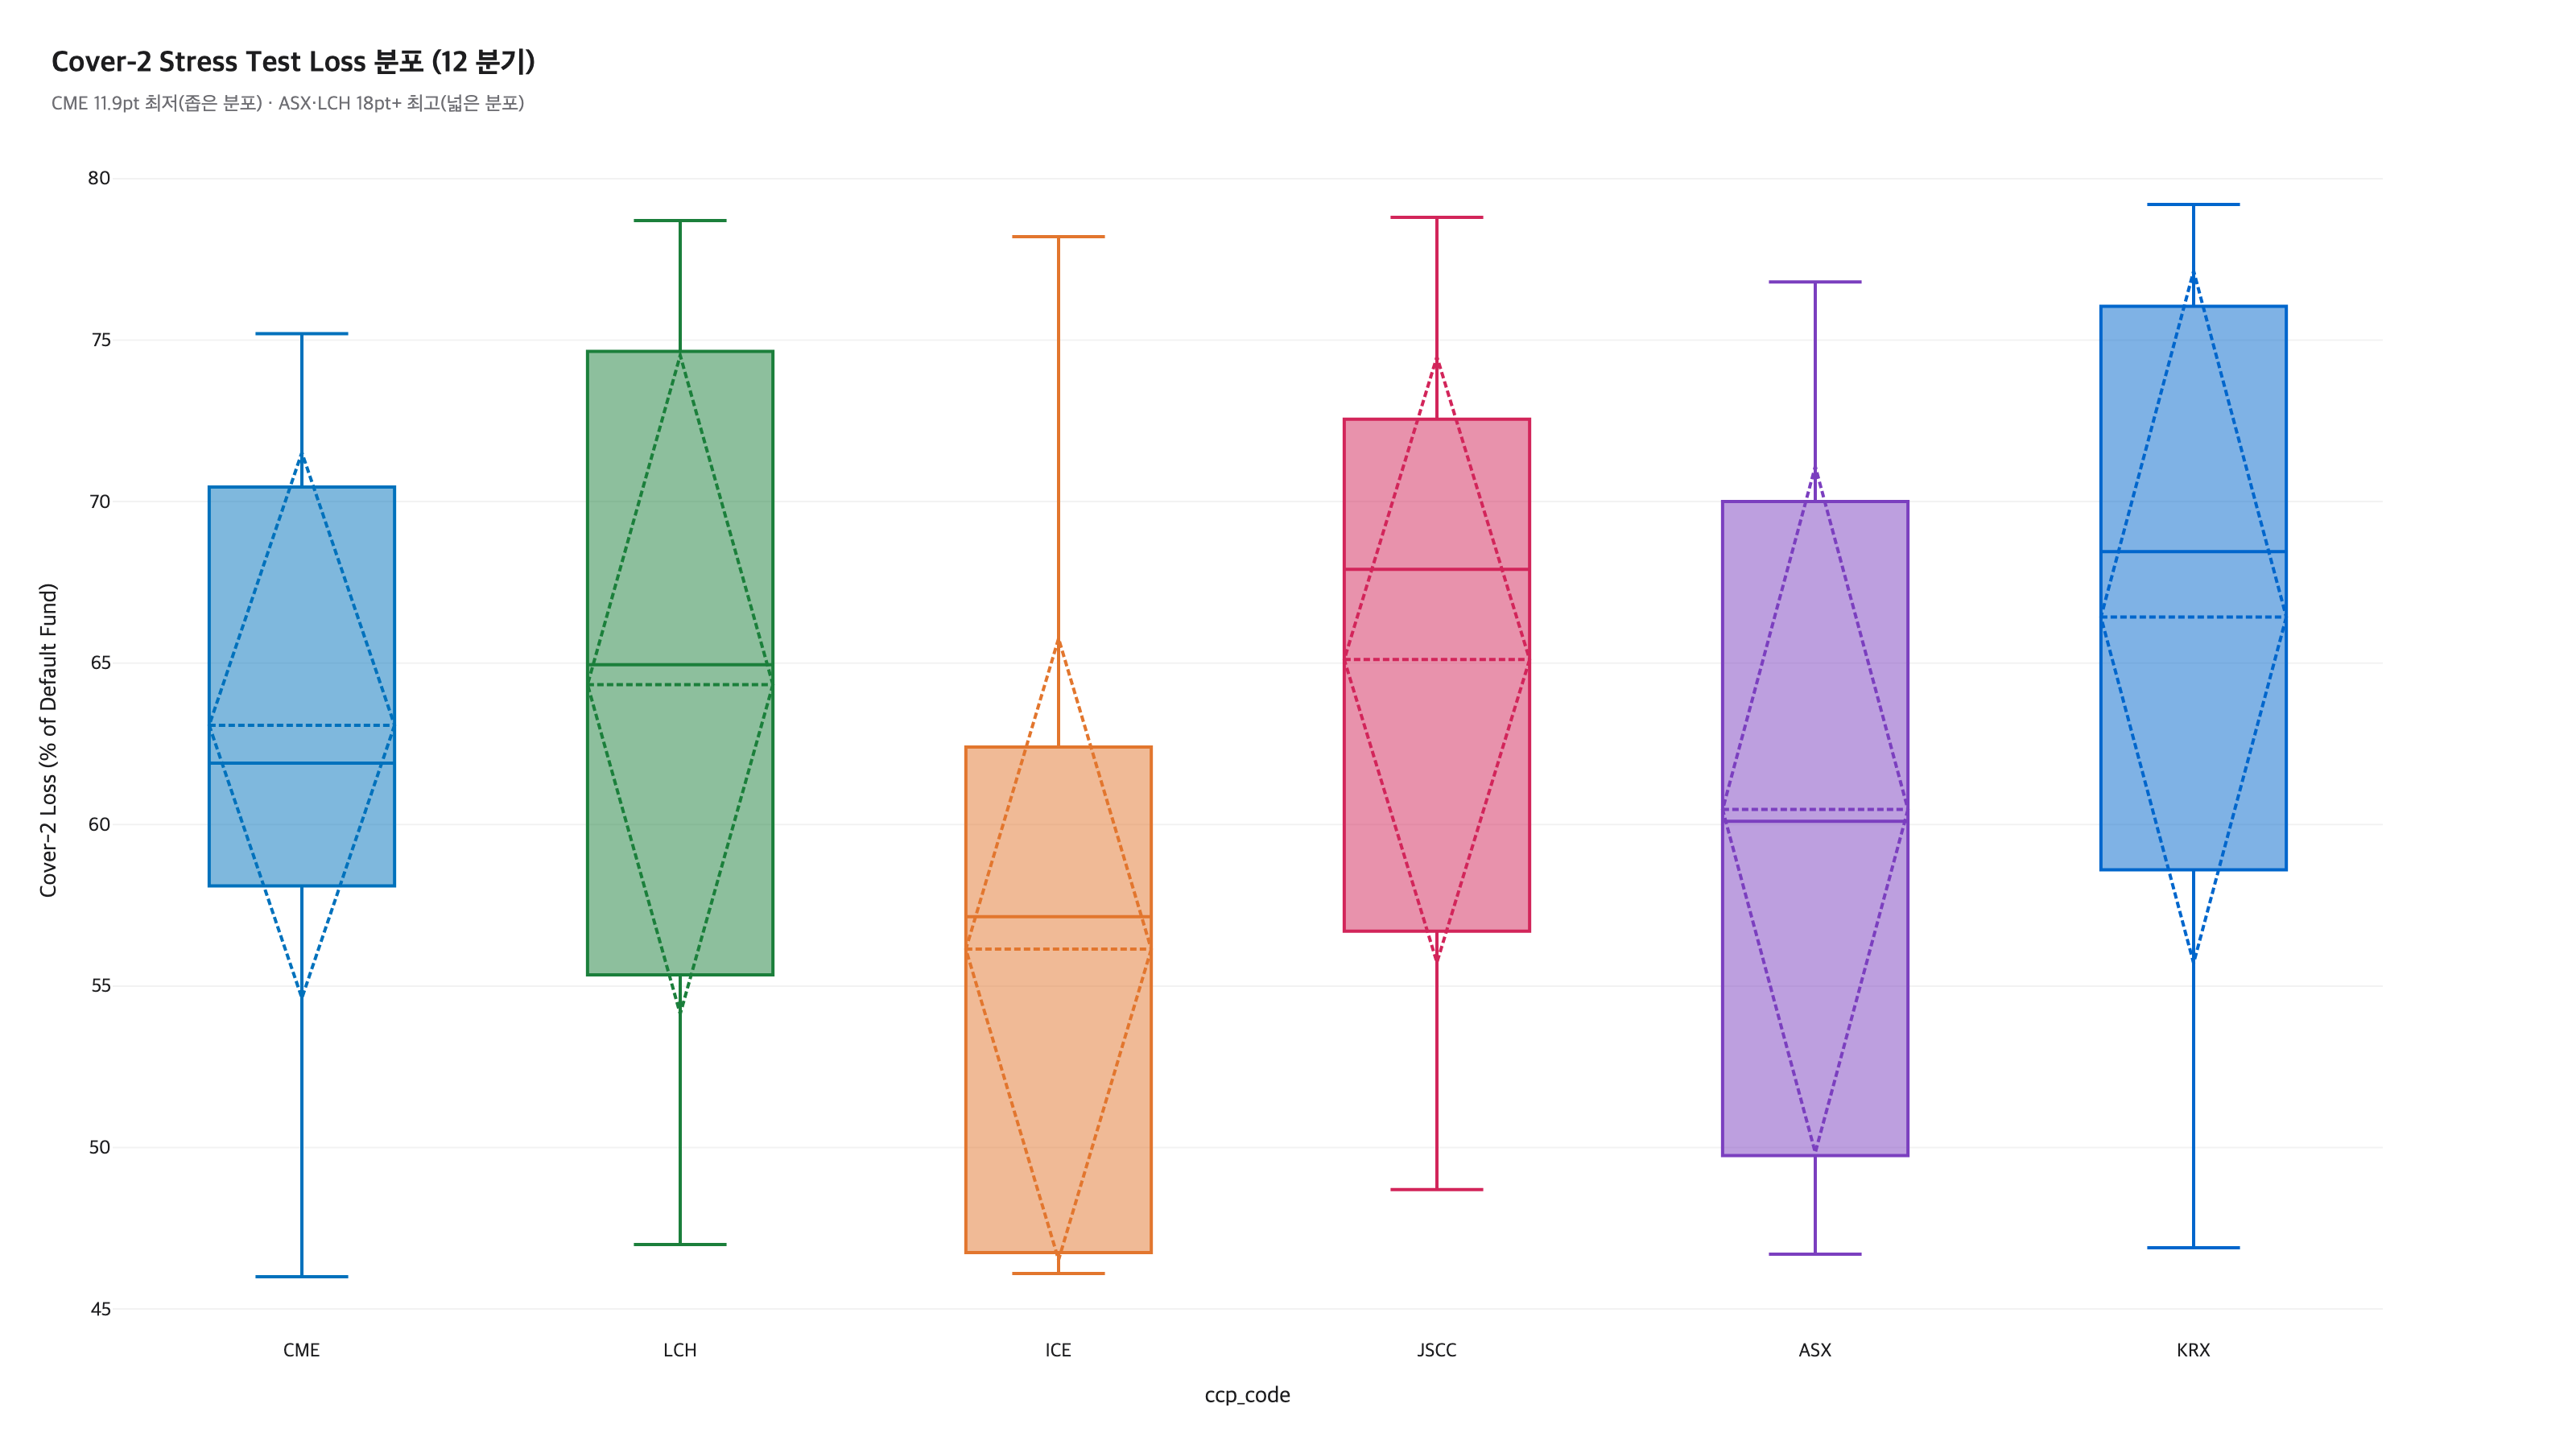
Cover-2 loss IQR by clearinghouse — CME lowest at 11.9pt (stable), ASX 18.5pt · LCH 18.3pt highest (volatility exposure). The APAC vs Americas/EMEA boundary is not clear-cut; it depends on each clearinghouse's asset composition.

Risk operations: Differences in cleared-asset diversity / concentration and margin-model calibration drive the variability of stress-test results. A narrow distribution signals stable model calibration; a wide one puts tail-risk response + calibration review on the next quarter's review agenda.

CHART C6

Correlation matrix across PQD metrics (Scatter Matrix)

Pairwise correlation of 4 metrics + color-coded by clearinghouse
C6 correlation matrix
▶ Insight C6

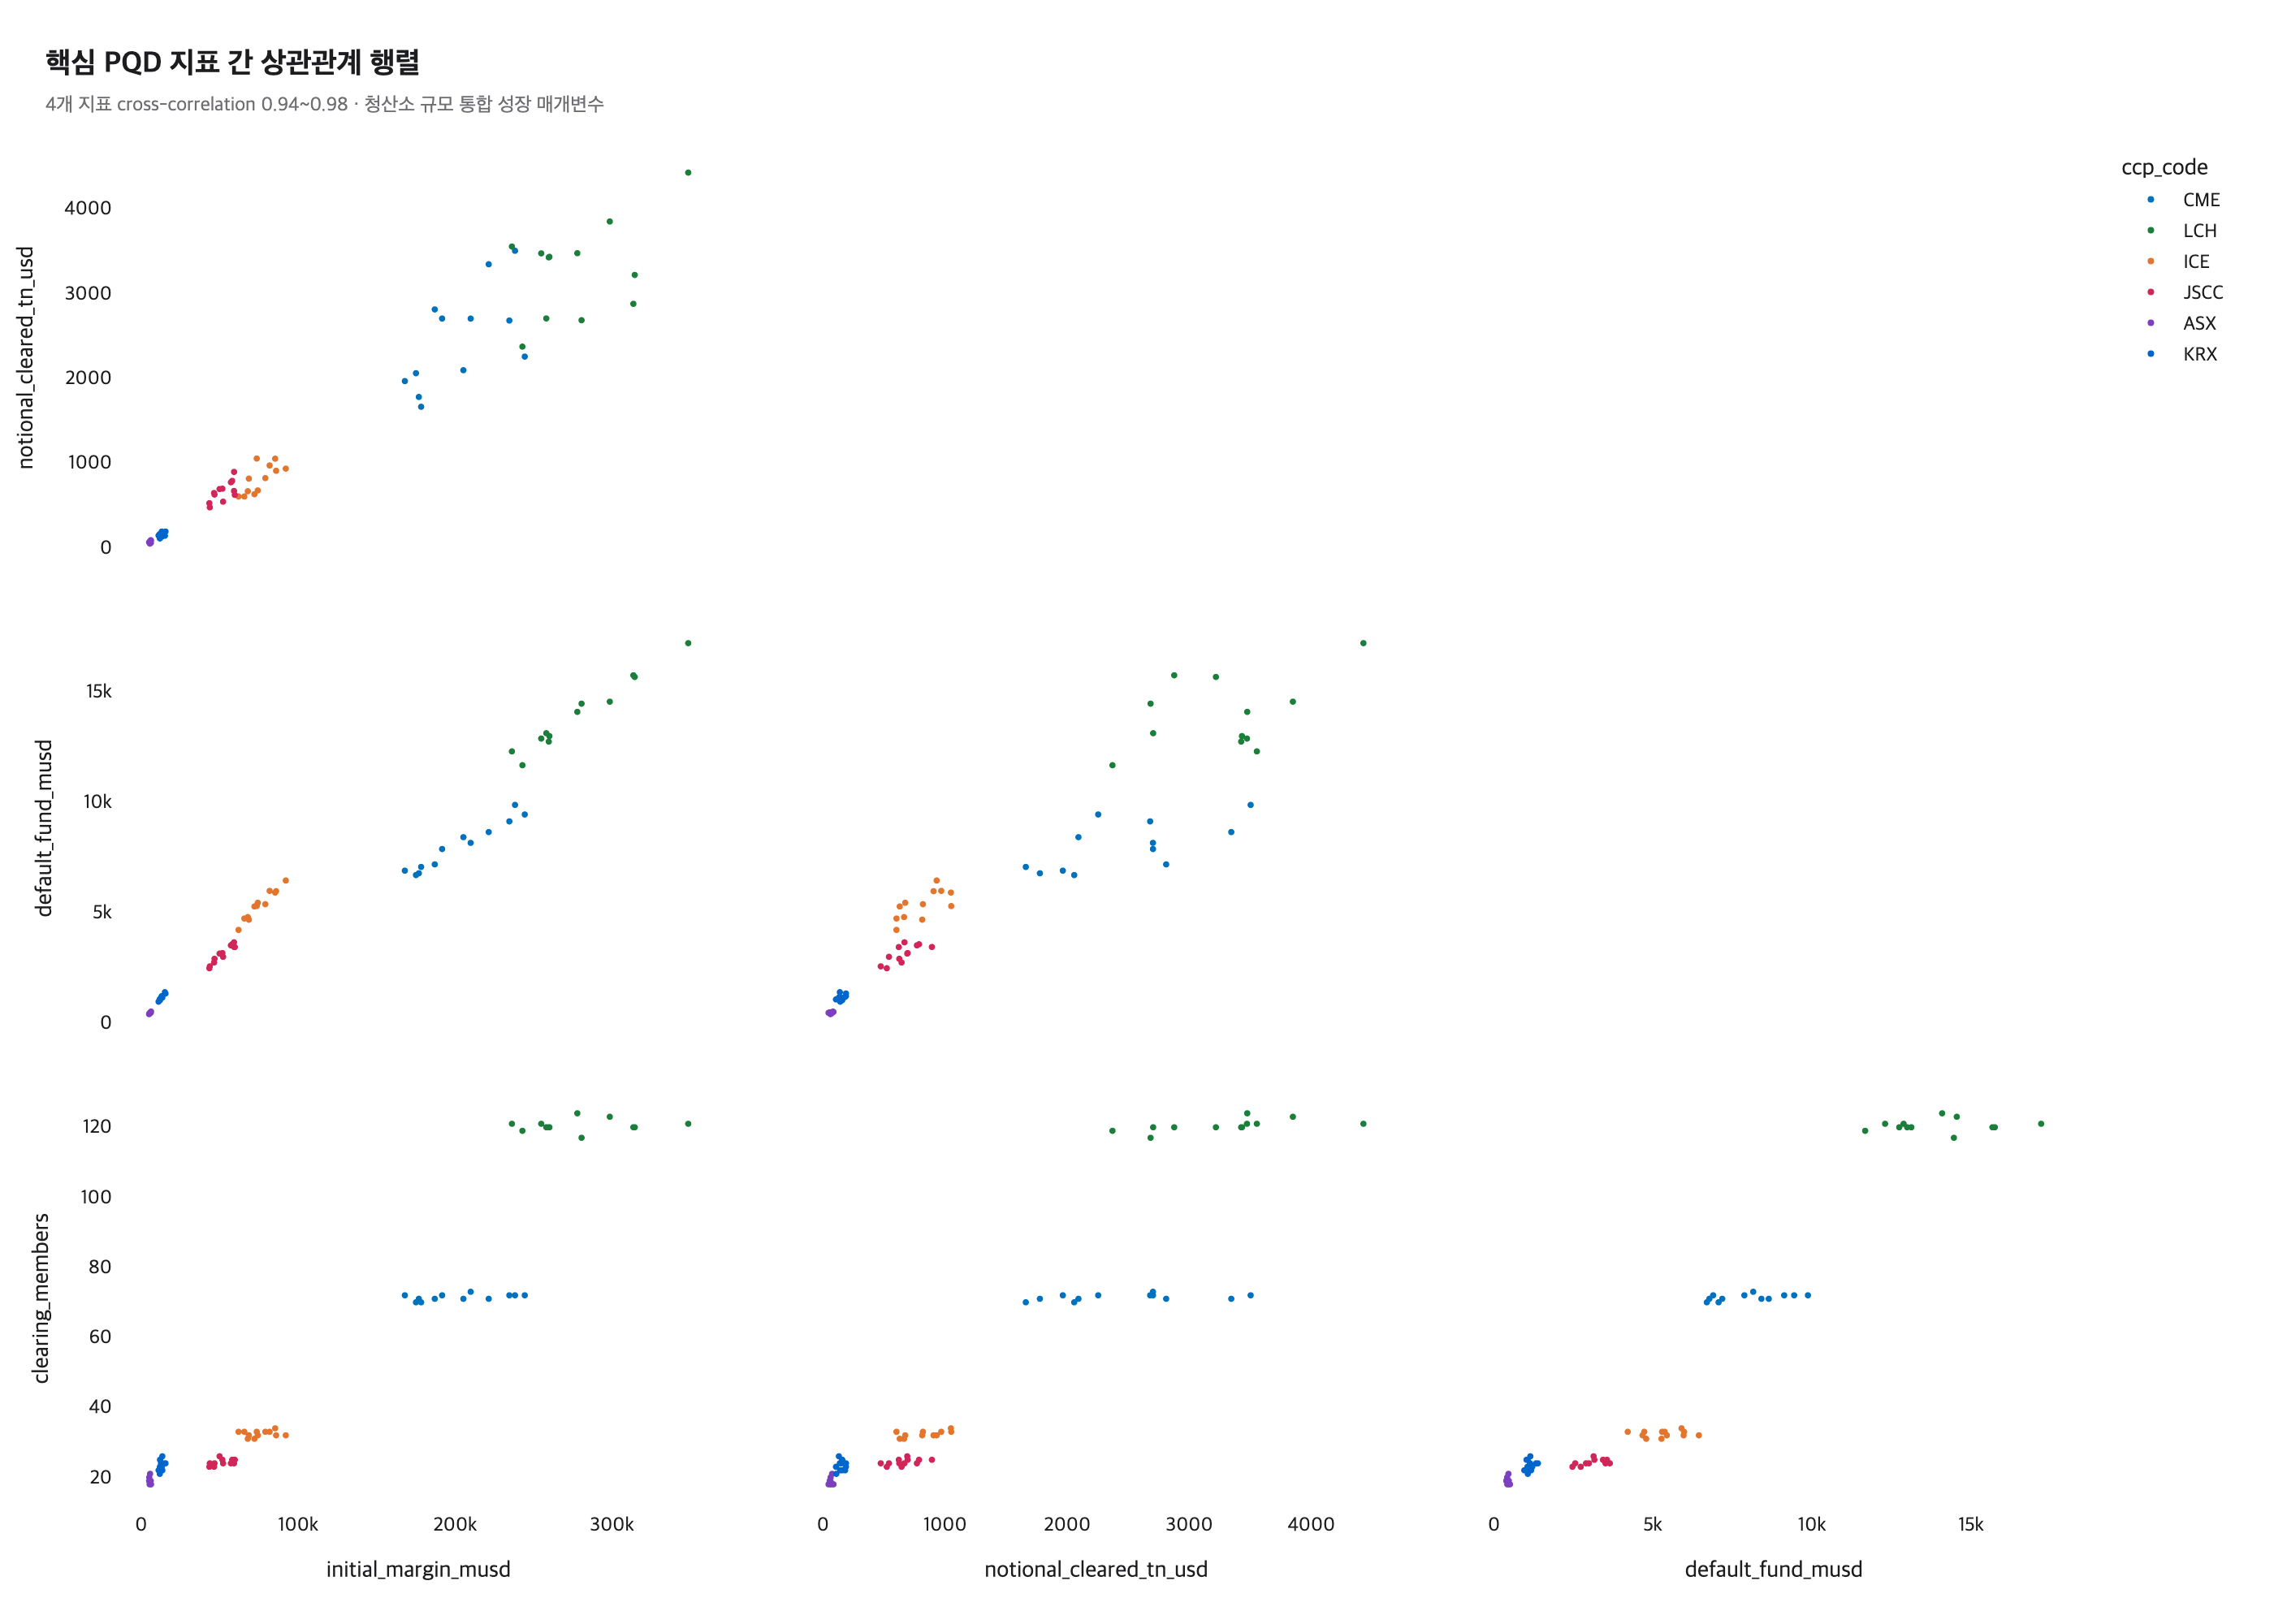
Initial Margin is strongly correlated with all three other metrics — Default Fund 0.977, Notional Cleared 0.973, Clearing Members 0.963. Cross-correlation across the 4 core metrics is 0.94–0.98 (※ co-movement is inherent to the synthetic-data structure — a similar pattern is also observed in real PQD).

Growth tracking: Trading volume, member count, and capital scale appear not as separate metrics but as a single growth axis that moves together. When KRX introduces new products or expands the market, estimating only the change in trading volume can carry the accompanying expansion in members and capital within the same picture. (Participation in Korea's market clearing infrastructure has a separated structure: a mandatory pass-through to KRX as the sole CCP under Capital Markets Act §378 + voluntary application for membership.)

CHART C7

Peak Intra-day Margin Call trend (Ratio Timeline)

12-quarter peak / IM ratio by clearinghouse
C7 peak intra-day
▶ Insight C7

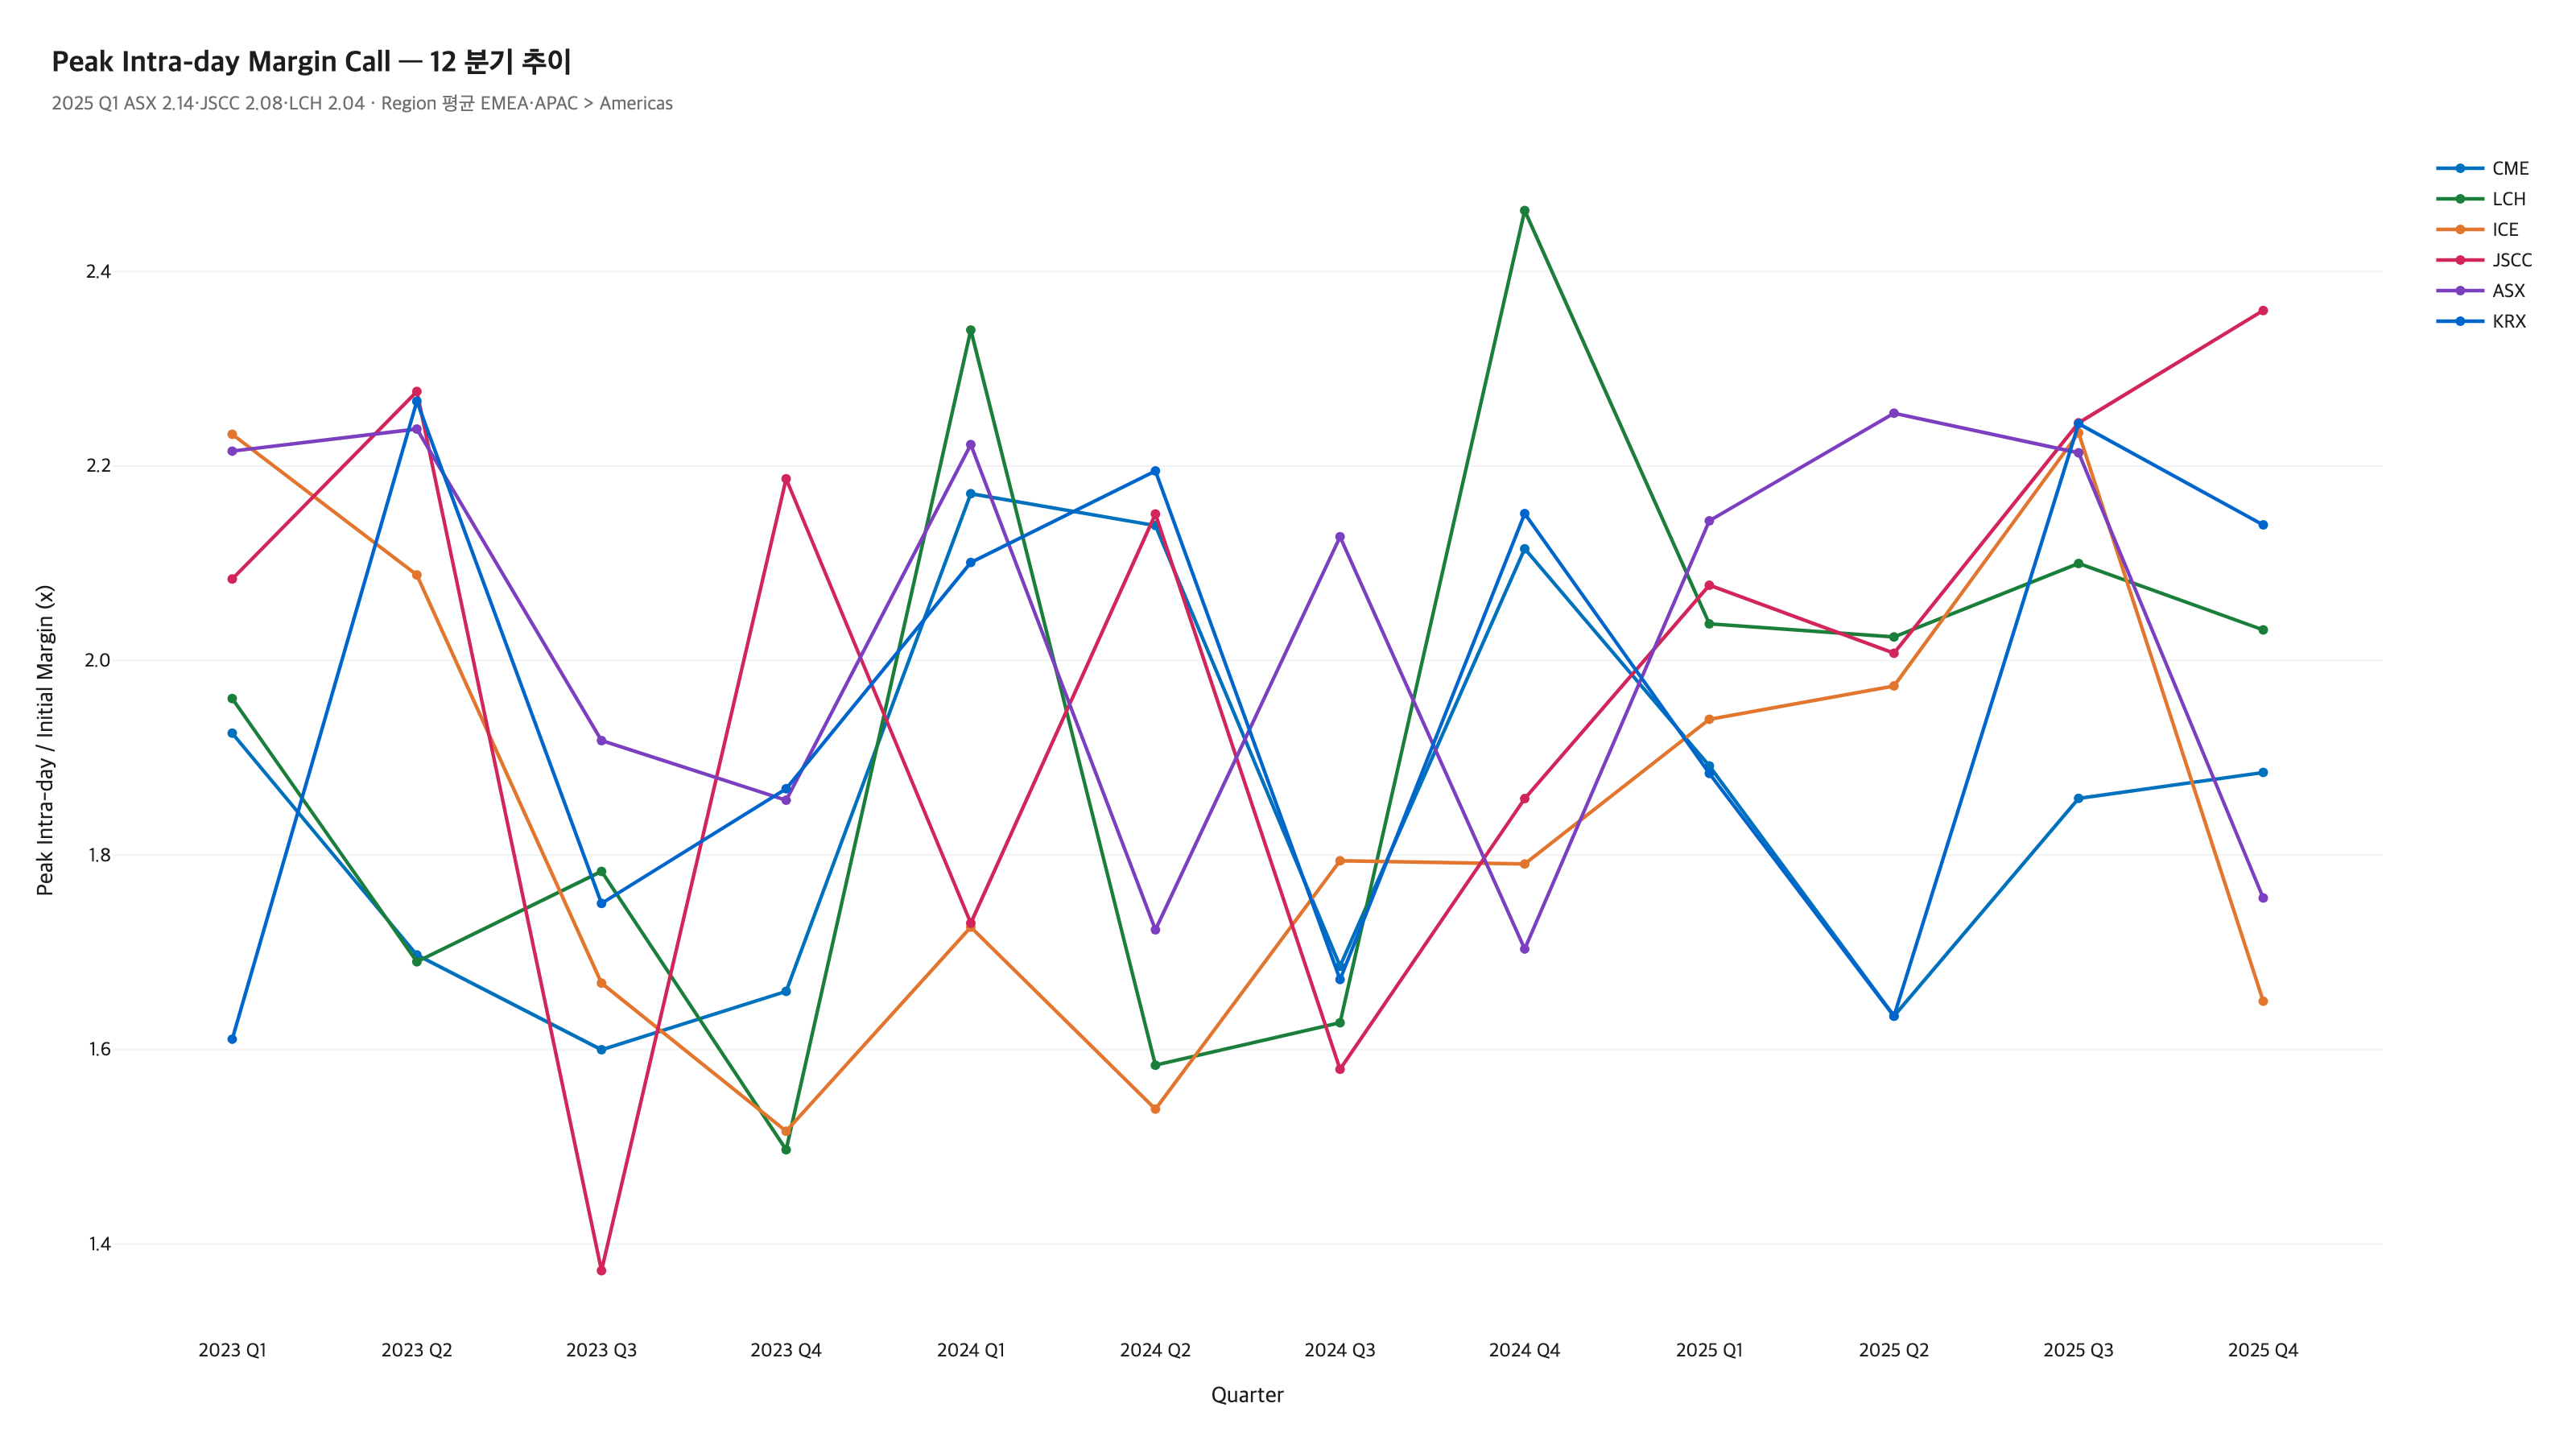
2025 Q1 ASX 2.14 · JSCC 2.08 · LCH 2.04 at the top. Region averages — EMEA 2.04 ≈ APAC 2.04 > Americas 1.92. Markets outside the US show larger intra-day spikes.

Member collateral: APAC · EMEA clearinghouses operate outside US close hours — a flow that first absorbs the volatility arising during Asian and European business hours is visible (for KRX, after-hours / night sessions were introduced by product: Options in 2010, Mini-KOSPI 200 Futures in 2016, KOSPI 200 Futures in 2021). For member firms with large FX and overseas-asset exposure, it can serve as a reference when timing how to communicate how the frequency and size of intra-day margin calls move quarter to quarter.

CHART C8

2025 Q4 core metrics summary (KPI Cards)

6 clearinghouses × 5 core metrics table · standard format for executive reporting
C8 KPI summary
▶ Insight C8

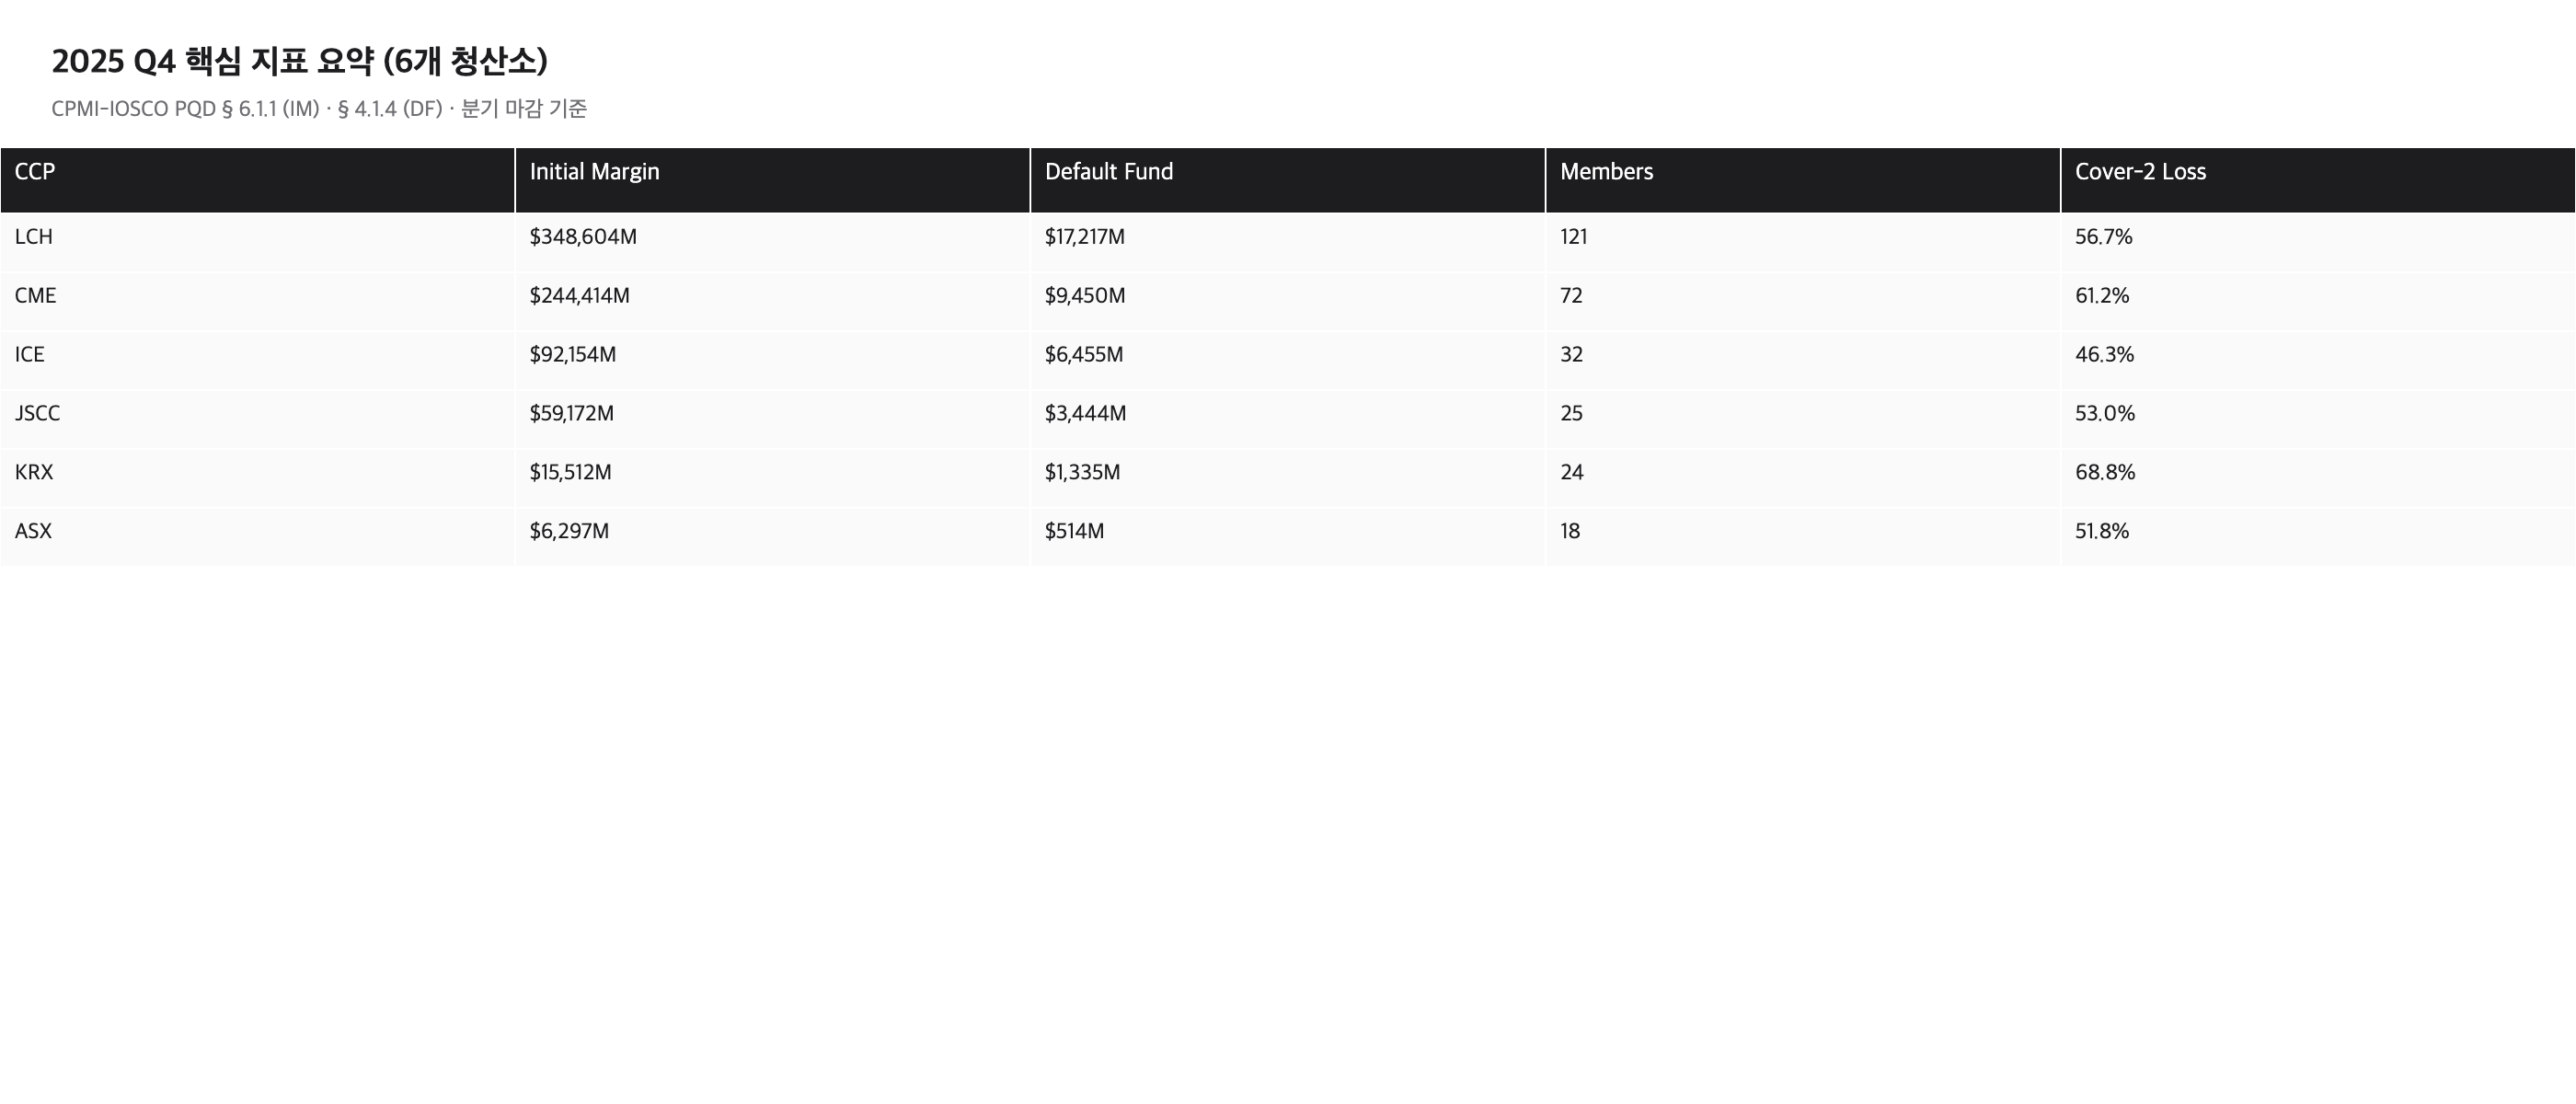
A one-screen summary for quarterly reporting. A consolidated comparison of size · Default Fund · Members · Cover-2.

Executive reporting: In board reporting material, a single slide can show KRX's position within the global benchmark. It is the screen format operators check first when opening a quarterly review meeting.


§ 4. Function Library & Handoff

A declarative interface for non-specialists to add charts

Once a function is pre-registered per chart type, adding a new chart takes a single function call. The library manages the design system — layout · colors · fonts — so domain experts focus only on data and axis mapping.

Code sample — declarative chart API

from charts_lib import render_line, render_bar_horizontal, render_heatmap # Add a time-series comparison chart — one line render_line( df, x="quarter", y="initial_margin_musd", group="ccp_code", title="Initial Margin Trend", highlight="KRX", ) # Add a heatmap — same pattern render_heatmap( df, x="quarter", y="ccp_code", value="intraday_ratio", title="Peak Intra-day / IM Ratio", )

YAML config — the actually working dashboard_runner

# dashboard.yaml — edited directly by the operator (actually works in the case study repo) data_source: data/processed/pqd_2023q1_2025q4.csv sections: - title: "Initial Margin Trend" chart: render_line params: {x: quarter, y: initial_margin_musd, group: ccp_code, highlight: KRX} - title: "2025 Q4 Size Ranking" chart: render_bar_horizontal filter: {quarter: "2025 Q4"} params: {x: initial_margin_musd, y: ccp_code}

→ Running uv run python scripts/dashboard_runner.py performs schema validation (columns · function existence) → chart rendering → records config_hash · data_hash · rows · timestamp to an audit log (audit_log.jsonl) — securing reproducibility and auditability.

📘 Excerpt from the handoff manual

"To add a new chart, add a new section to dashboard.yaml. Under chart:, write a predefined function name (render_line · render_bar · render_heatmap, etc.), and under params:, map the column names. Typos and non-existent columns are blocked at schema validation as actionable errors. You can add, remove, and reorganize charts without modifying any code."

Interactive dashboard — live demo

Streamlit dashboard interactive demo — CCP filter reactive update
Changing the CCP filter in the left sidebar reactively updates four charts at once — C1 time series · C3 heatmap · C6 correlation · C8 KPI summary. Member firm demos · executive reporting · validation of new analytical assumptions are all handled in the same interface.
(In the PDF this is a static frame; for live behavior, see the case study HTML or the plic-portfolio page.)

Scope of this case study vs additional deliverables in a real project

✓ This case study (portfolio scope)
Synthetic data · 8 chart types · function library · YAML loader (3-section demo) · audit log · schema validation · single-page HTML
+ Additional deliverables in a real KRX project
Direct DB integration (sqlalchemy) · LDAP/SAML access control · Docker compose on-prem deployment · automated PDF/Excel export · automated quarterly refresh · pytest coverage · operations manual · one new-hire training session

§ 5. Summary & Next Steps

PLIC Studio data analysis capabilities in summary

This case study demonstrates connecting PQD standard data to the KRX operational decision-making flow.

Charts come with domain interpretation, and the function library · YAML config · audit log actually work.

  • Accurate reference to the CPMI-IOSCO PQD standard (§ 6.1.1 IM · § 4.1.4 DF · § 6.8 Peak Intra-day)
  • Function library + YAML loader (3-section demo, dashboard_runner.py runnable within this repo)
  • Python + Streamlit + Plotly stack — handling an in-house LAN deployment scenario of ~10 active users in normal times / a spike of 30–50 during quarterly presentations (Streamlit caching + per-session isolation)
  • Cross-CCP synchronization patterns are separated from single-clearinghouse moves and used as a basis for deciding the reporting flow
  • Region-by-region volatility differences can be reflected in the priority of quarterly review items

Deliverables for a KRX PQD project

SCOPE 1
PQD Ingestion Pipeline
New DB schema → Python sqlalchemy adapter + quarterly-refresh validation. Isolates the impact area of column changes.
SCOPE 2
Quarterly Peer Benchmark
A same-format comparison dashboard for KRX + 6 global CCPs. Quarterly analysis material for the risk management team.
SCOPE 3
Intraday Margin Stress Dashboard
Monitoring cross-CCP synchronized spikes right after quarterly disclosures. Observation thresholds + departmental alert triggers.
SCOPE 4
Executive PDF/Excel Export
A 1-slide quarterly KPI + appendix tables. Auto-generates the standard format for board and financial-supervisor reporting.

※ All 4 deliverables above apply the function library + YAML config pattern consistently.
Additional deliverables in a real project: access control (LDAP · SAML integration), intranet deployment (Docker compose / on-prem),
config · data · chart version tracking (execution logs for reproducibility checks + git integration),
direct integration with quarterly output data from the KRX EXTURE+ Koscom system · conformance with the Capital Markets Act §378 clearing-institution reporting format.

Standard timeline · quote: Based on the 25–30 working-day timeframe agreed on the call. After reviewing the SCOPE 1–4 combination and the actual DB schema, we will send a formal quote separately.

Next Case Study preview

CASE 02 Financial-metrics visualization for Korean listed companies (DART API)
CASE 03 E-commerce sales & customer-behavior analysis (RFM segmentation)
CASE 04 Real estate market data (public data + external API)

Commission a data analysis

Finance · public sector · e-commerce · healthcare — domain-agnostic. Standard-conformant work like CPMI-IOSCO is available.