PLIC Studio · Case Study 02 · Seoul Real Estate Transactions
The decision question — when should we launch sales, and which districts should we benchmark against? It started from the operational decisions of developer IR teams, PropTech firms, and brokerage agencies.
One Seoul, a 3.02× gap in price per pyeong. Building the baseline for sales-launch and operating decisions.
Built on the Ministry of Land, Infrastructure and Transport's KOGL Type 1 (Korea Open Government License — attribution; commercial use & modification permitted) public transaction-price data:
an analysis of 39,021 sale transactions across 5 Seoul districts × 24 months +
9 district-level visualization charts + a handoff-ready function library pattern.
With a Python · Plotly · Streamlit · Polars stack, it connects sales-launch timing decisions, price-prediction model inputs, and sales operations material in a single flow.
※ This case study is a sales asset built on actual measured data sourced from the Public Data Portal. It carries no legal effect; for external citation, please review the § 2 disclaimer.
Public Data Portal source (no usage-license restrictions) + anonymization + time-series policy awareness
This case study uses the sale-transaction data provided by the Ministry of Land, Infrastructure and Transport (MOLIT) Real Transaction Price Disclosure System.
It falls under KOGL Type 1 (Korea Open Government License — attribution; commercial use & modification permitted), and the Public Data Portal (data.go.kr) usage license is explicitly marked "no restrictions", so commercial use, modification, and derivative works are all permitted. It may be cited freely once the source is attributed.
All complex (apartment-development) names are masked, and dong/unit precision is limited to prevent identification of individual transactions.
Source attribution (Public Data Portal recommended format)
This work uses the 'Apartment Sale Transaction Price Detail Data' (2024–2025), created by the 'Ministry of Land, Infrastructure and Transport' and opened on the Public Data Portal (data.go.kr ID 15126468)
with a usage license of no restrictions;
the work can be downloaded for free from the MOLIT Real Transaction Price Disclosure System (https://rt.molit.go.kr).
⚠ No legal effect + analysis-basis disclaimer
The information in this service has no legal effect, and for external disclosure, official statistical data based on the report date must be used.
(Consistent with the verbatim notice of the MOLIT Real Transaction Price Disclosure System — rt.molit.go.kr)
The figures in this case study are for sales-asset demonstration only and may not be used for actual transaction, contract, tax, or review decisions.
Analysis basis: This analysis uses the API response's dealYear/Month/Day columns (= contract date) as the time-series axis. External official statistics are published on a report-date basis, so quarterly and monthly aggregates may differ from this analysis.
📊 Data cleansing + anonymization policy
Raw source: MOLIT Real Transaction Price Open API (data.go.kr ID 15126468)
Cancelled deals (cdealType=='O') removed — 41,304 raw → 39,021 records analyzed (5.5% cancellation rate)
Brokered vs. direct transactions separated (consistent with the dealingGbn column)
30-day reporting obligation + a practical safety cut: §3 of the Real Estate Transaction Reporting Act mandates reporting within 30 days of the contract date. On top of that, this analysis applies an additional 2-month safety cut to avoid reporting gaps right after a quarter close
Complex (development) name masking (sales-asset anonymization policy)
5 districts analyzed: Gangnam-gu 11680 · Seocho-gu 11650 · Songpa-gu 11710 · Mapo-gu 11440 · Nowon-gu 11350 (Ministry of the Interior and Safety statutory dong codes)
🗓 Time-series policy awareness points
2020.07 — Three Lease Acts enacted (right to request lease renewal + ceiling on rent increases, Housing Lease Protection Act amendment). This case analyzes sales only, so there is no direct impact, but residual market sentiment remains
2021.06.01 — Lease (jeonse/wolse) Reporting System enacted (a separate scheme). No direct impact on the sale time series — only awareness is needed that lease reporting was split off as a separate obligation
2022.05.10 ~ 2026.05.09 — Temporary suspension of the heavy capital-gains tax on multiple-home owners (4 years). The entire analysis period (2024–2025) falls within the suspension window → a policy interval in which multiple-home owners had an incentive to sell
2024~2025 — 2024.01 end of the Special Bogeumjari Loan · 2025.07 Stress DSR Phase 3 enacted · partial adjustment of the price ceiling on new-sale apartments (widening regional variation)
Analysis window: 2024-01 ~ 2025-12 (24 months). Policy changes are considered separately when interpreting time-series results
Provisional-value caution: due to reporting-timing differences, data from the 1–2 months right after a quarter close may be subsequently revised
Note as of sending — The temporary suspension of the heavy capital-gains tax on multiple-home owners ended on 2026-05-09. This analysis period falls within the suspension window, a policy interval in which multiple-home owners had an incentive to sell. If a market re-measurement right after the suspension's end is needed, it can be reproduced immediately with the same function library.
PLIC Data Methodology
Question → Analysis → Decision. The 3 steps this case followed.
This real estate analysis, too, started from a decision question rather than a tool. The flow below connected 39,021 records to operational decision-making.
01 · FRAMING
Decision framing
Define the decision questions of sales-launch timing, benchmark districts, and price range from the perspective of developer IR teams, PropTech firms, and brokerage agencies.
02 · BUILD
Build the analysis
Clean 39,021 records from the MOLIT Open API (5.5% cancellation cut) + a per-district quarterly model + 9 interactive charts.
03 · DELIVER
Deliver & measure
Per-district domain insights + function-library handoff + a reproducible pipeline.
§ 3. Analysis & Visualisation
9 charts · a district-level visualization flow
Each chart comes with both an actual measured pattern and a domain-application message.
These are unpacked observation points that can be combined with operational flows such as sales-launch timing decisions, price-prediction model inputs, and sales operations material.
(Each chart ≈ 30 seconds · about 5 minutes total · per-audience use cases are summarized in the separate box in § 5)
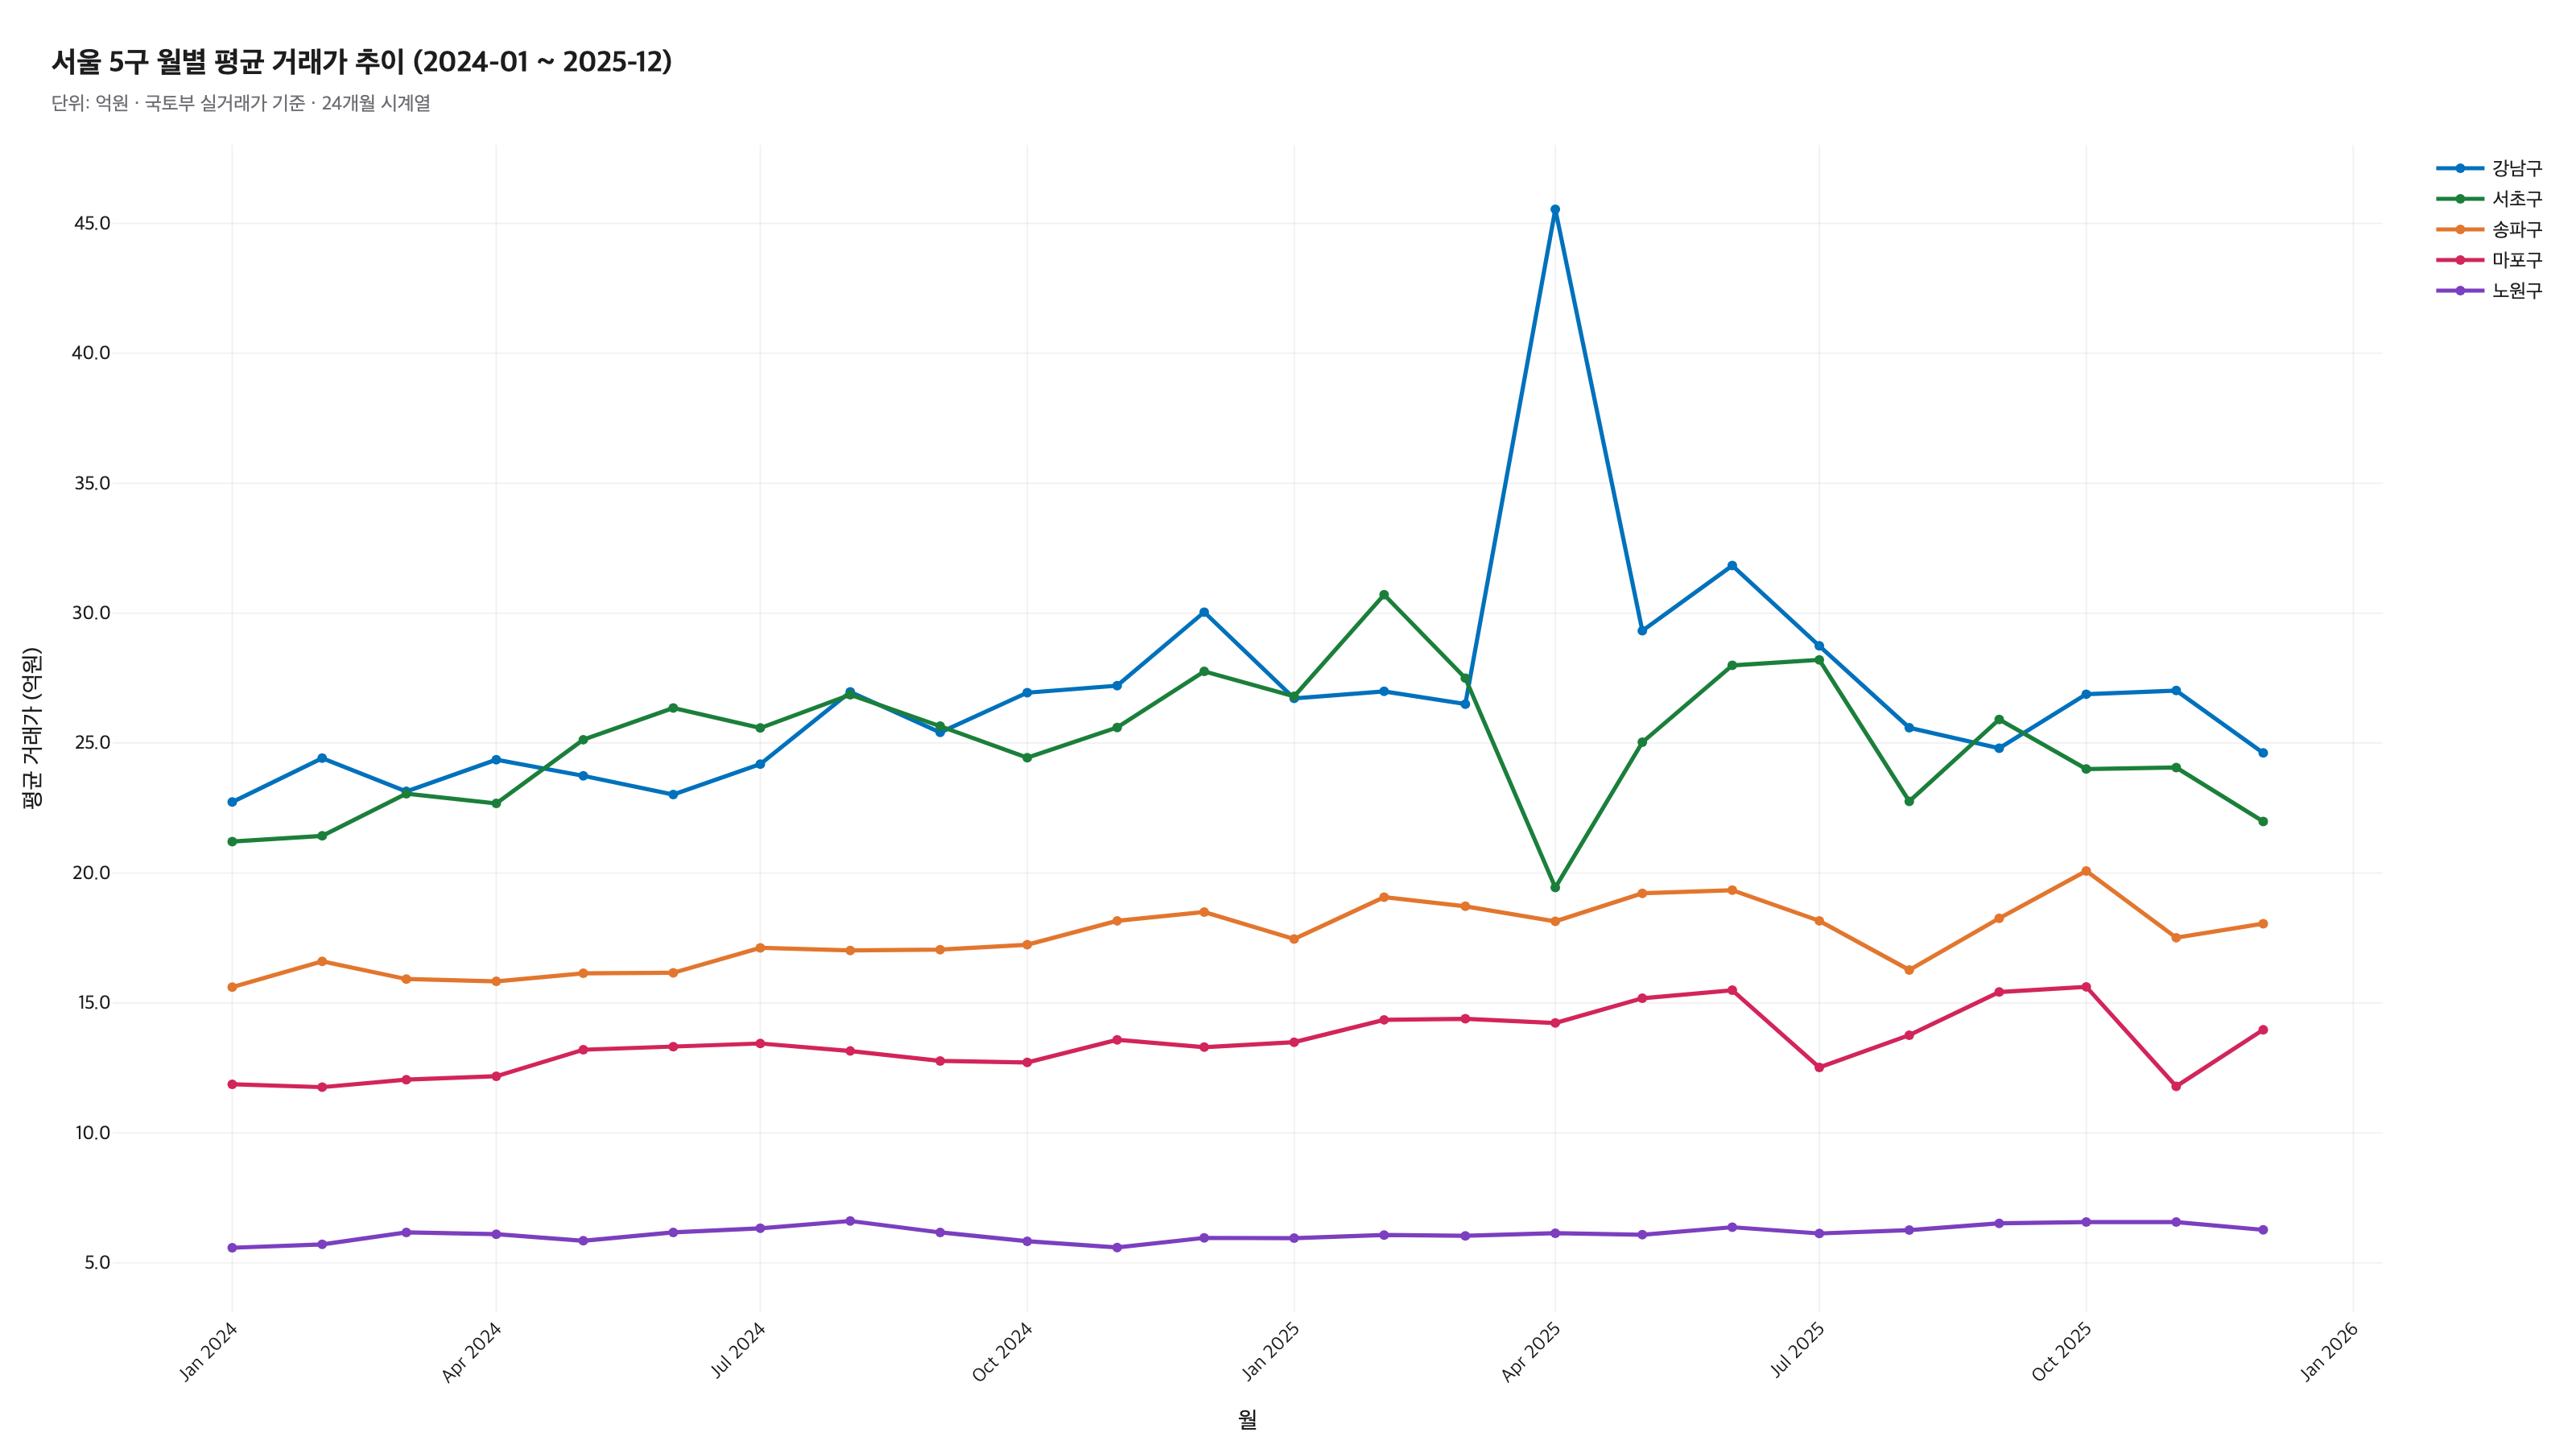
CHART C1
Monthly average transaction price trend across 5 Seoul districts (24 months)
2024-01 ~ 2025-12 · 5-district line trend · simultaneous comparison of price levels and volatility by district
▶ Insight C1
Over the 24-month time series, all 5 districts trended upward. Average price 2024-01 vs 2025-12 — Gangnam 2.273B → 2.462B KRW (+8.3%), Seocho 2.121B → 2.198B (+3.6%), Songpa 1.561B → 1.805B (+15.6%), Mapo 1.187B → 1.397B (+17.7%), Nowon 0.558B → 0.627B (+12.4%). The absolute gap (Gangnam vs Nowon) widened from 1.715B to 1.835B, while the ratio gap narrowed slightly from 4.07× to 3.93×. ※ These C1 figures are a single-month comparison of 2024-01 vs 2025-12, whereas the C8 KPIs are a 2024 average vs 2025 average comparison (the figures differ due to the difference in basis, e.g. Mapo +17.7% vs +13.9%).
The 24-month average-price trend can be used for explaining the price position at sales launch, feeding the trend fit of a price-prediction model, and comparing per-district flows in buyer/seller price-adjustment meetings. This chart itself is historical descriptive; where extrapolation is needed, a separate forecasting step must be combined.
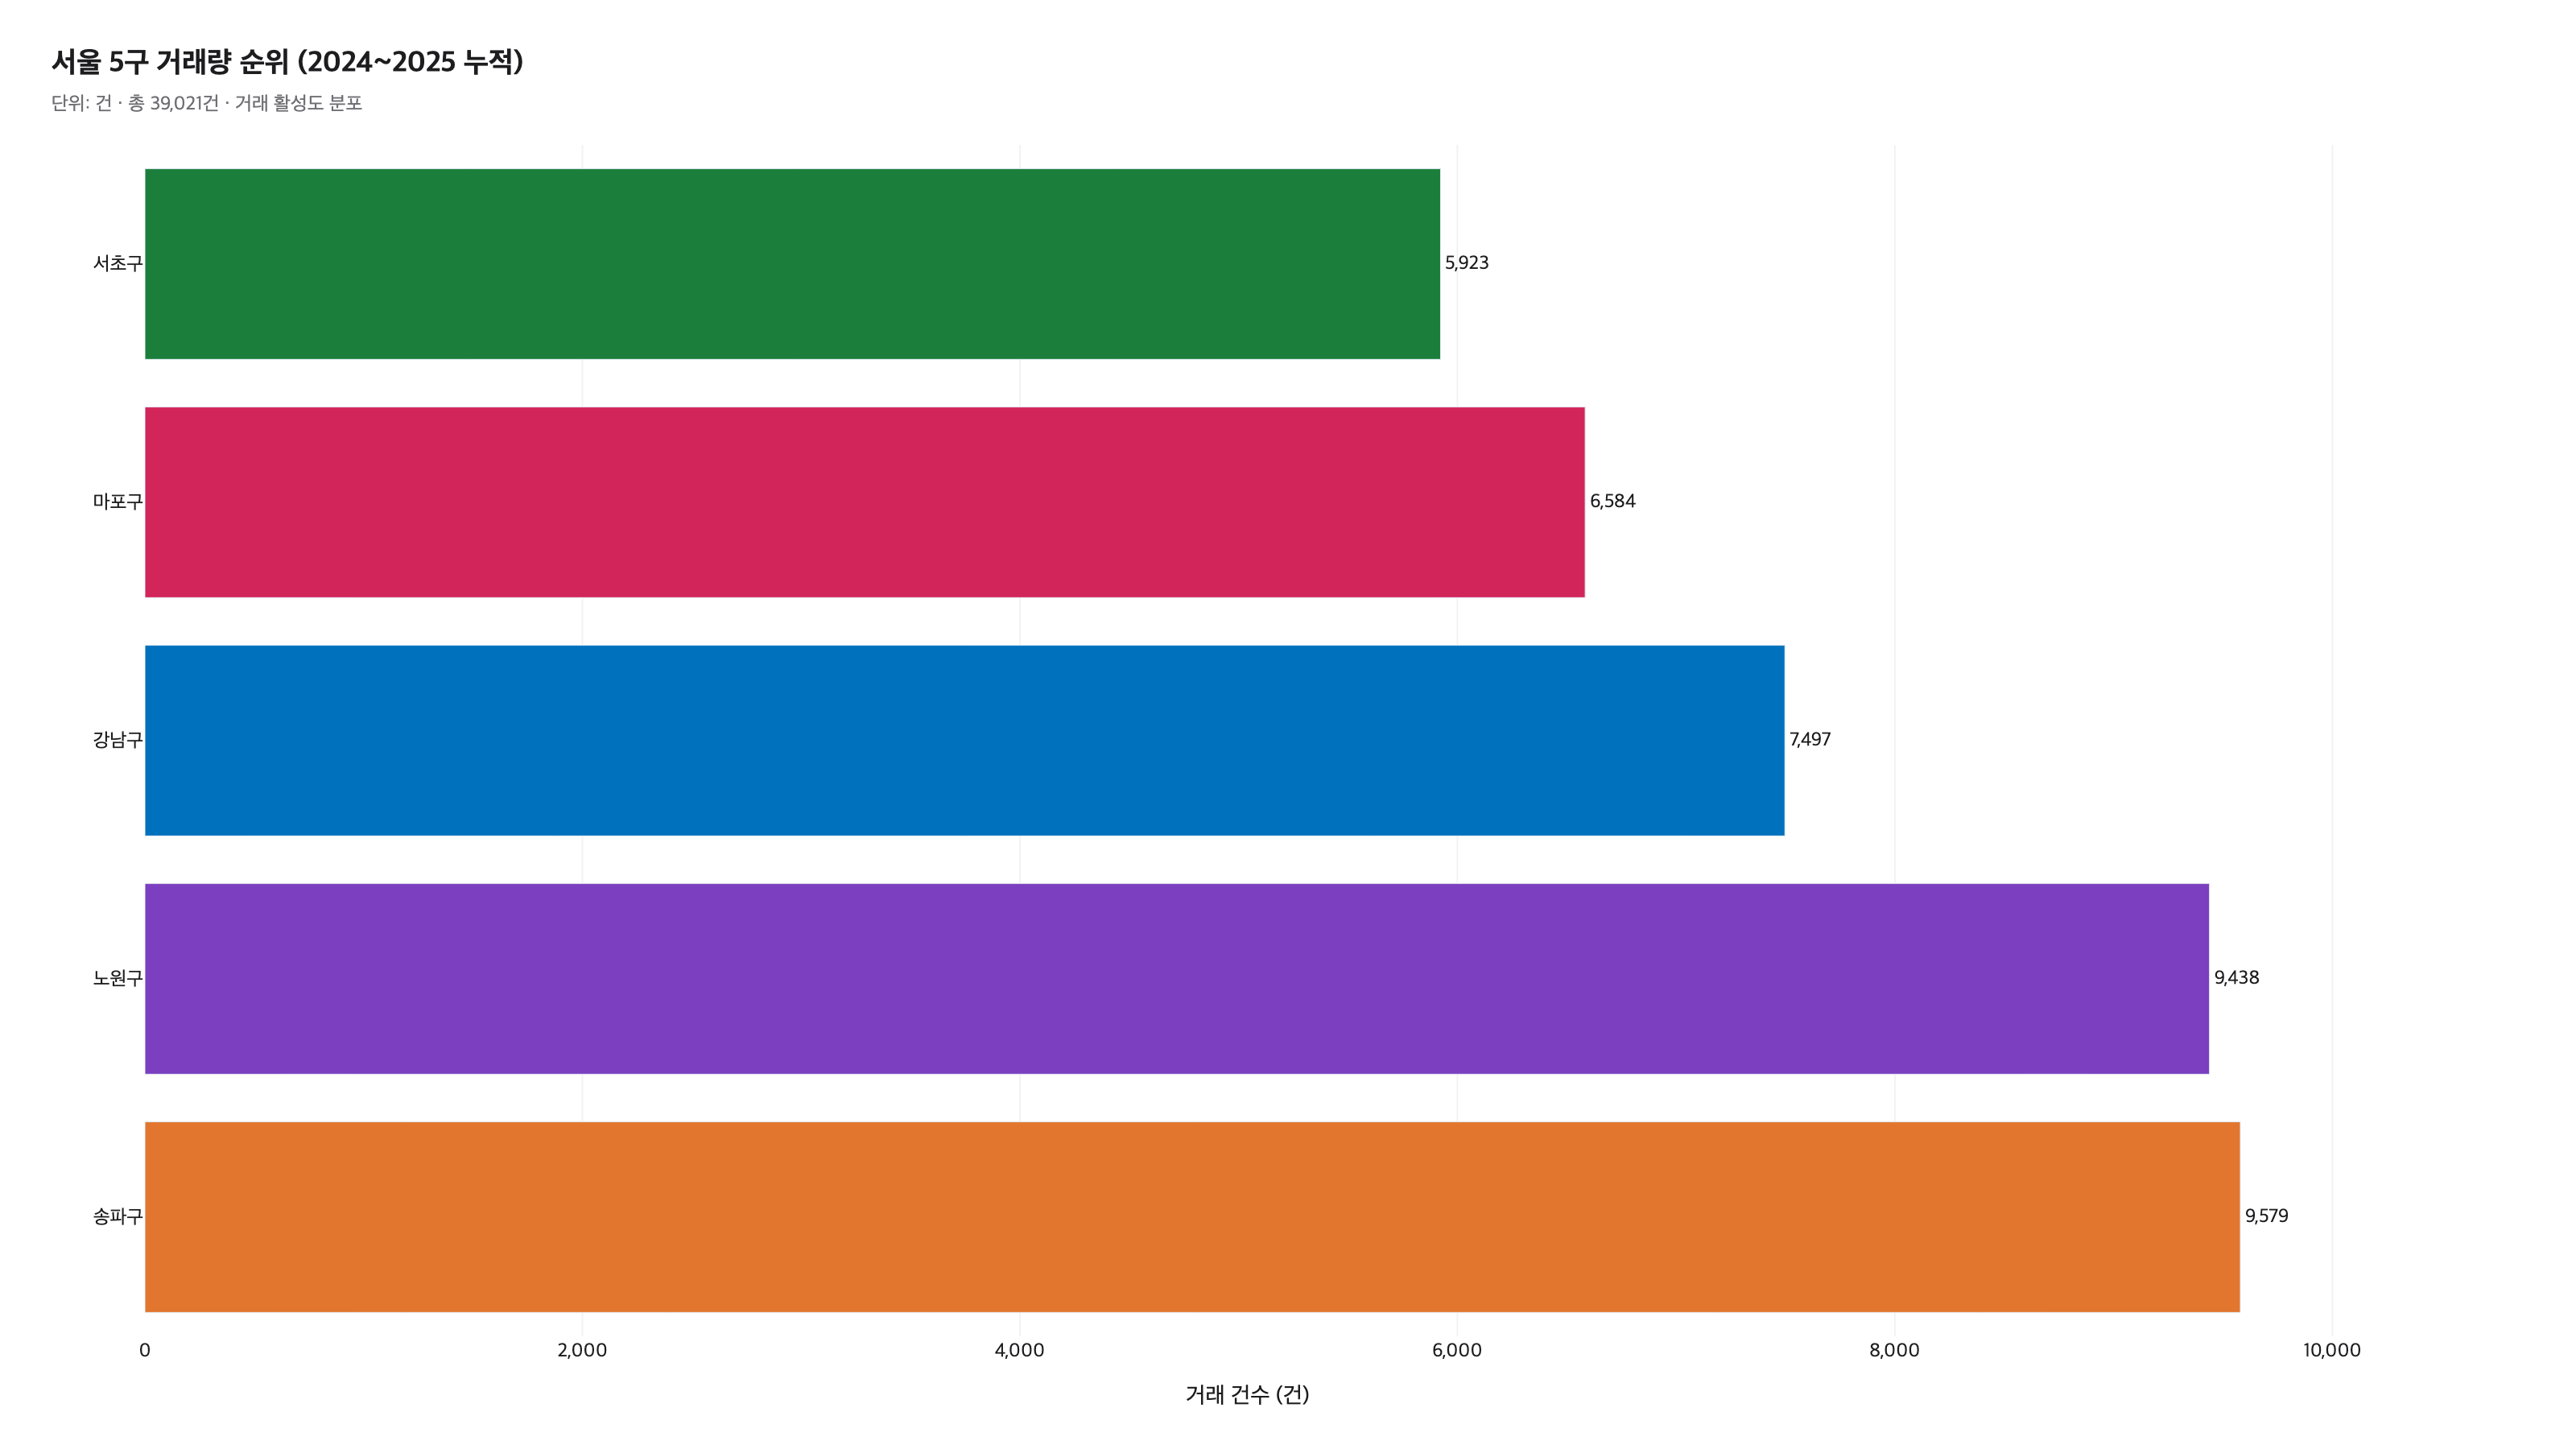
CHART C2
Transaction-volume ranking of 5 Seoul districts (24-month cumulative)
By sale transaction count · a market-turnover signal that diverges from the average-price ranking
▶ Insight C2
Songpa 9,579 > Nowon 9,438 > Gangnam 7,497 > Mapo 6,584 > Seocho 5,923. The most (Songpa) vs the least (Seocho) is a 1.62× gap. Gangnam and Seocho rank 1st and 2nd in average price but 3rd and 5th in volume — diverging into a high-price, low-turnover market.
Sales-network prioritization: a starting point for deciding to place staff in high-volume districts (Songpa, Nowon) and veterans in high-average-price districts (Gangnam, Seocho). Seocho's low volume may signal a listing shortage + waiting buyers, giving grounds to run a separate listing-supply analysis.
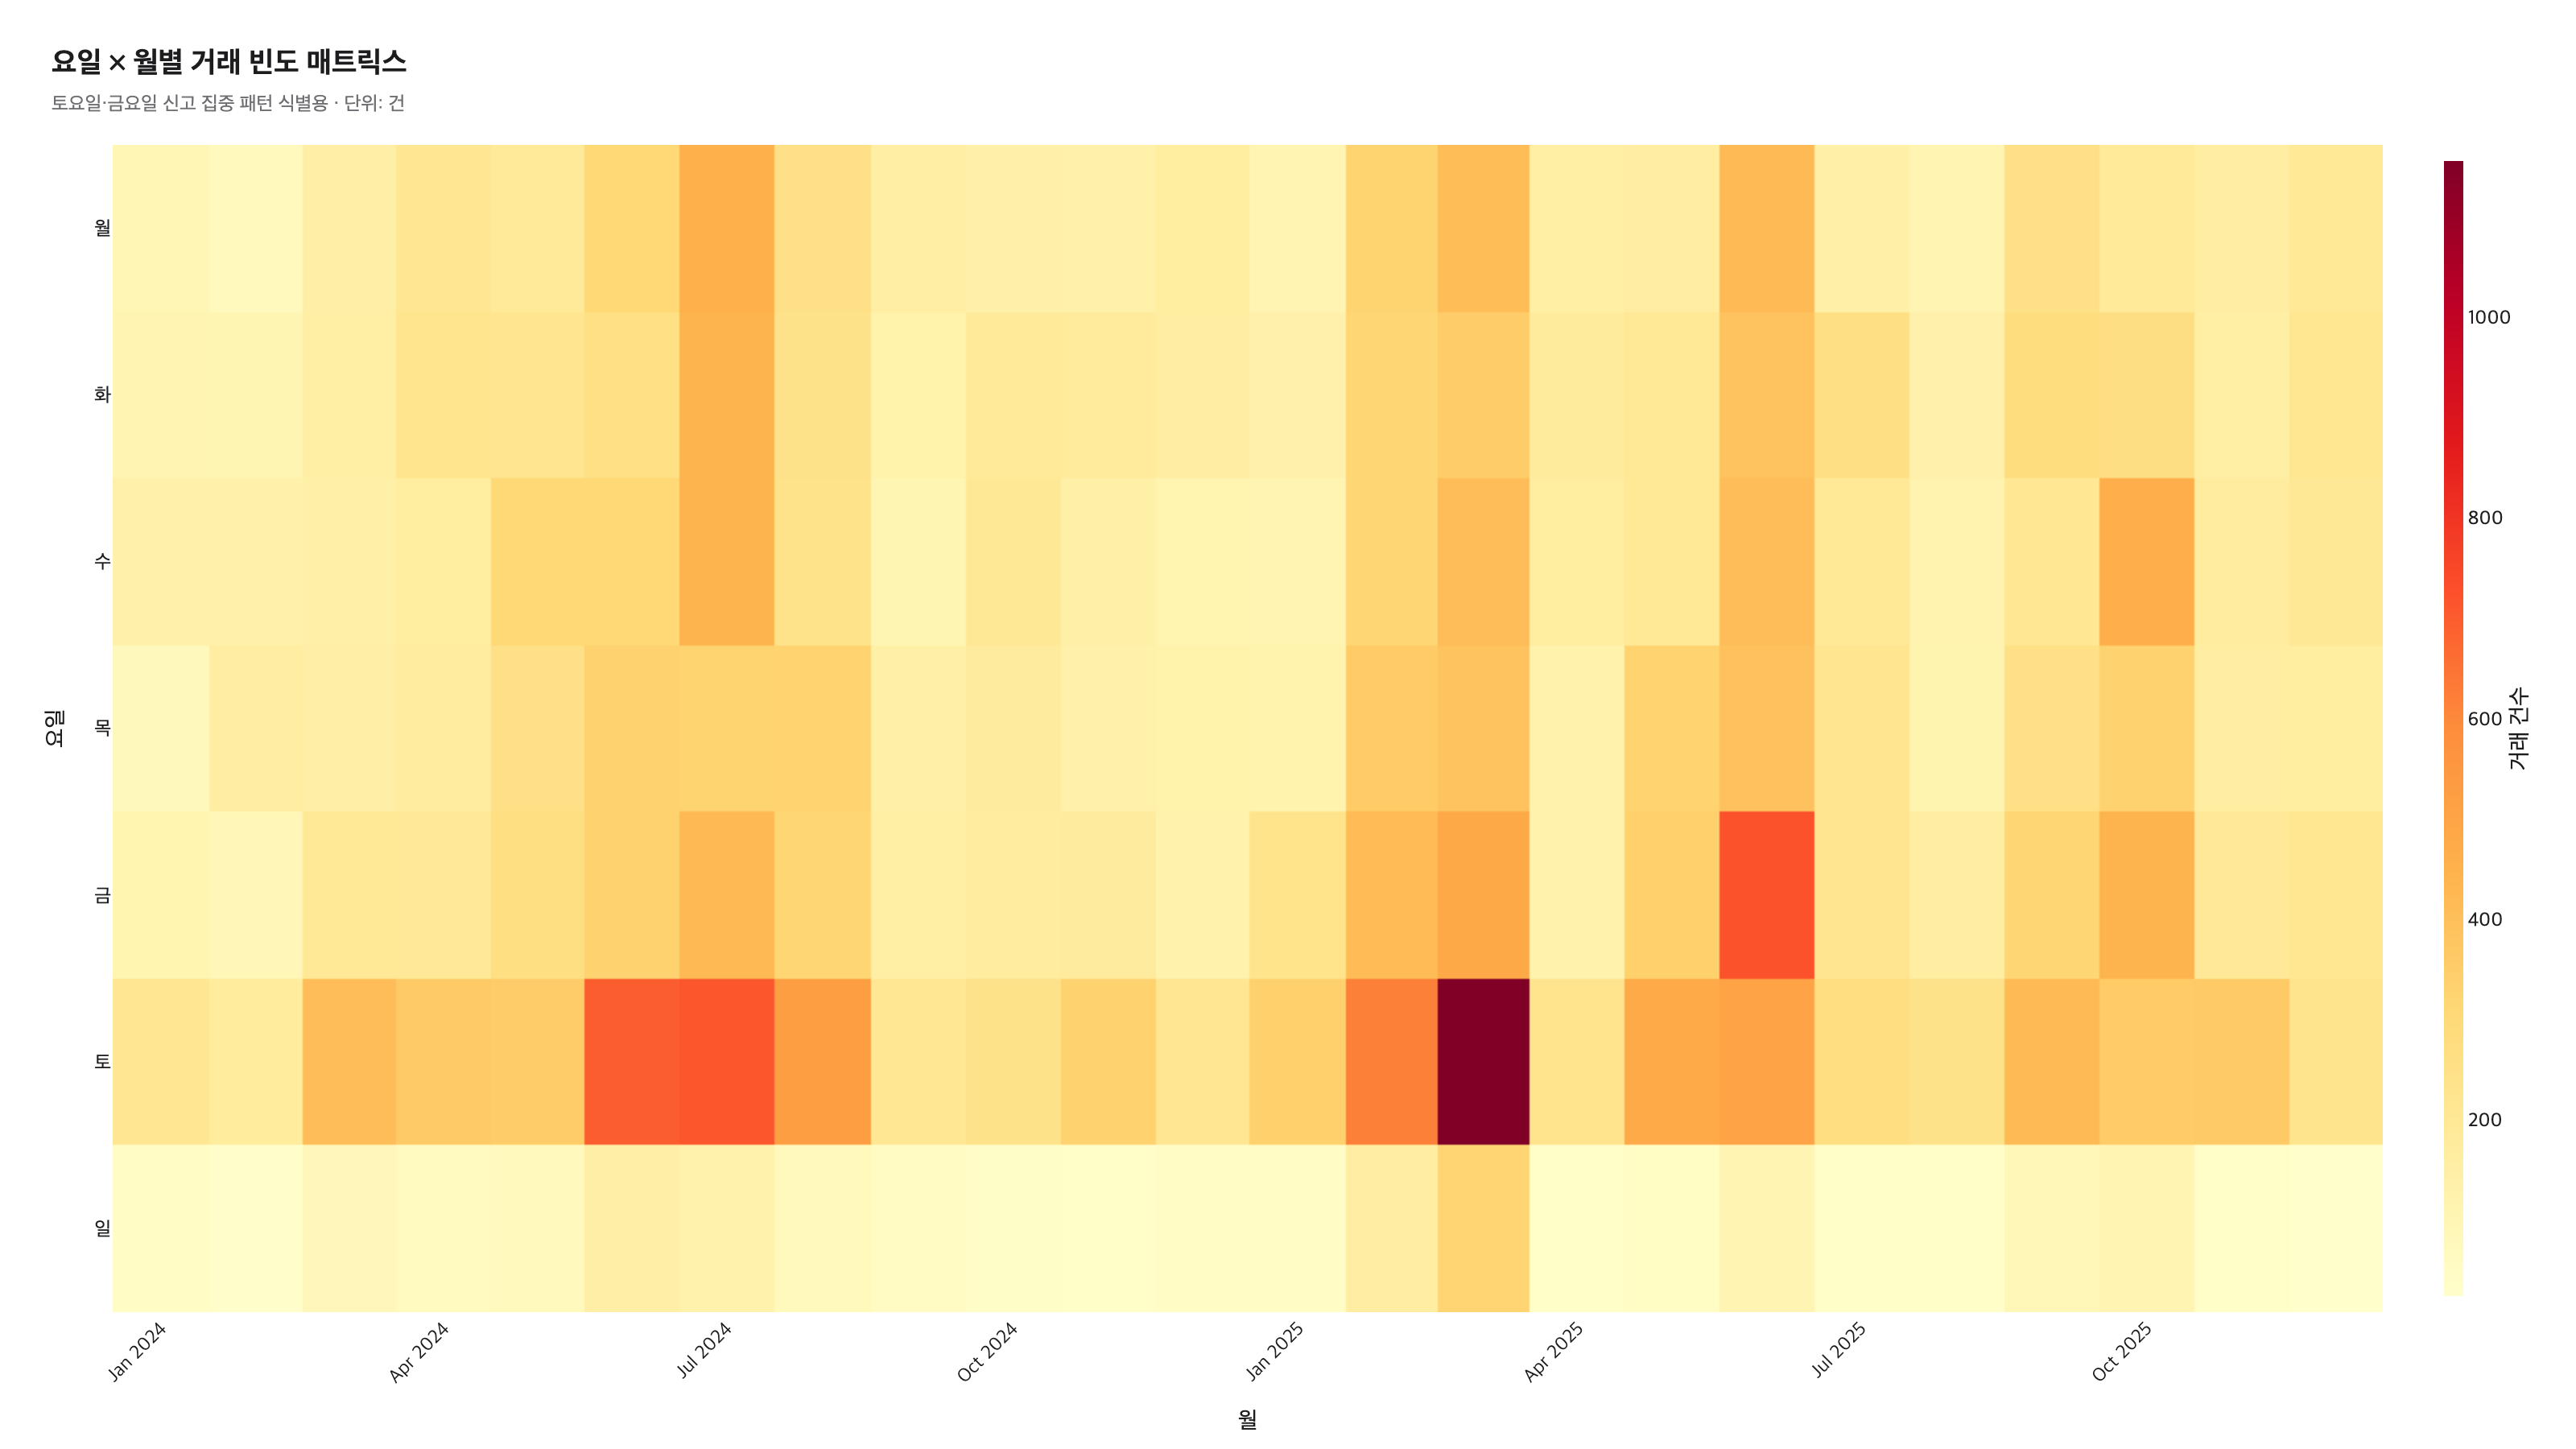
Contract-date-based weekday/month transaction distribution · organizing sales and operations patterns
▶ Insight C3 (contract-date basis)
Weekday share by contract date — Sat 24.7% (9,657) > Fri 16.5% > Wed 13.9% > Thu 13.7% > Tue 13.6% > Mon 12.7% > Sun 4.9%. Saturday contract dates make up a quarter of the total, and Sunday is under 5%. The Sat/Fri concentration reflects a flow of weekday negotiation → weekend contract signing. ※ The API response's dealYear/Month/Day is the contract date, while the report date (rgstDate) is a separate column. There may be quarter-level differences from external official statistics.
Standardizing sales operations: place model-house and brokerage-office staff on Sat/Fri, while Sunday work is low-efficiency at a 5% share. Data fetch frequency: daily batches incur a 1–2 day Monday reporting lag, so weekly batches are more efficient. Because the pattern is stable across 24 months, it can serve as a fixed input for sales and operations unless transaction-reporting policy changes.
CHART C4
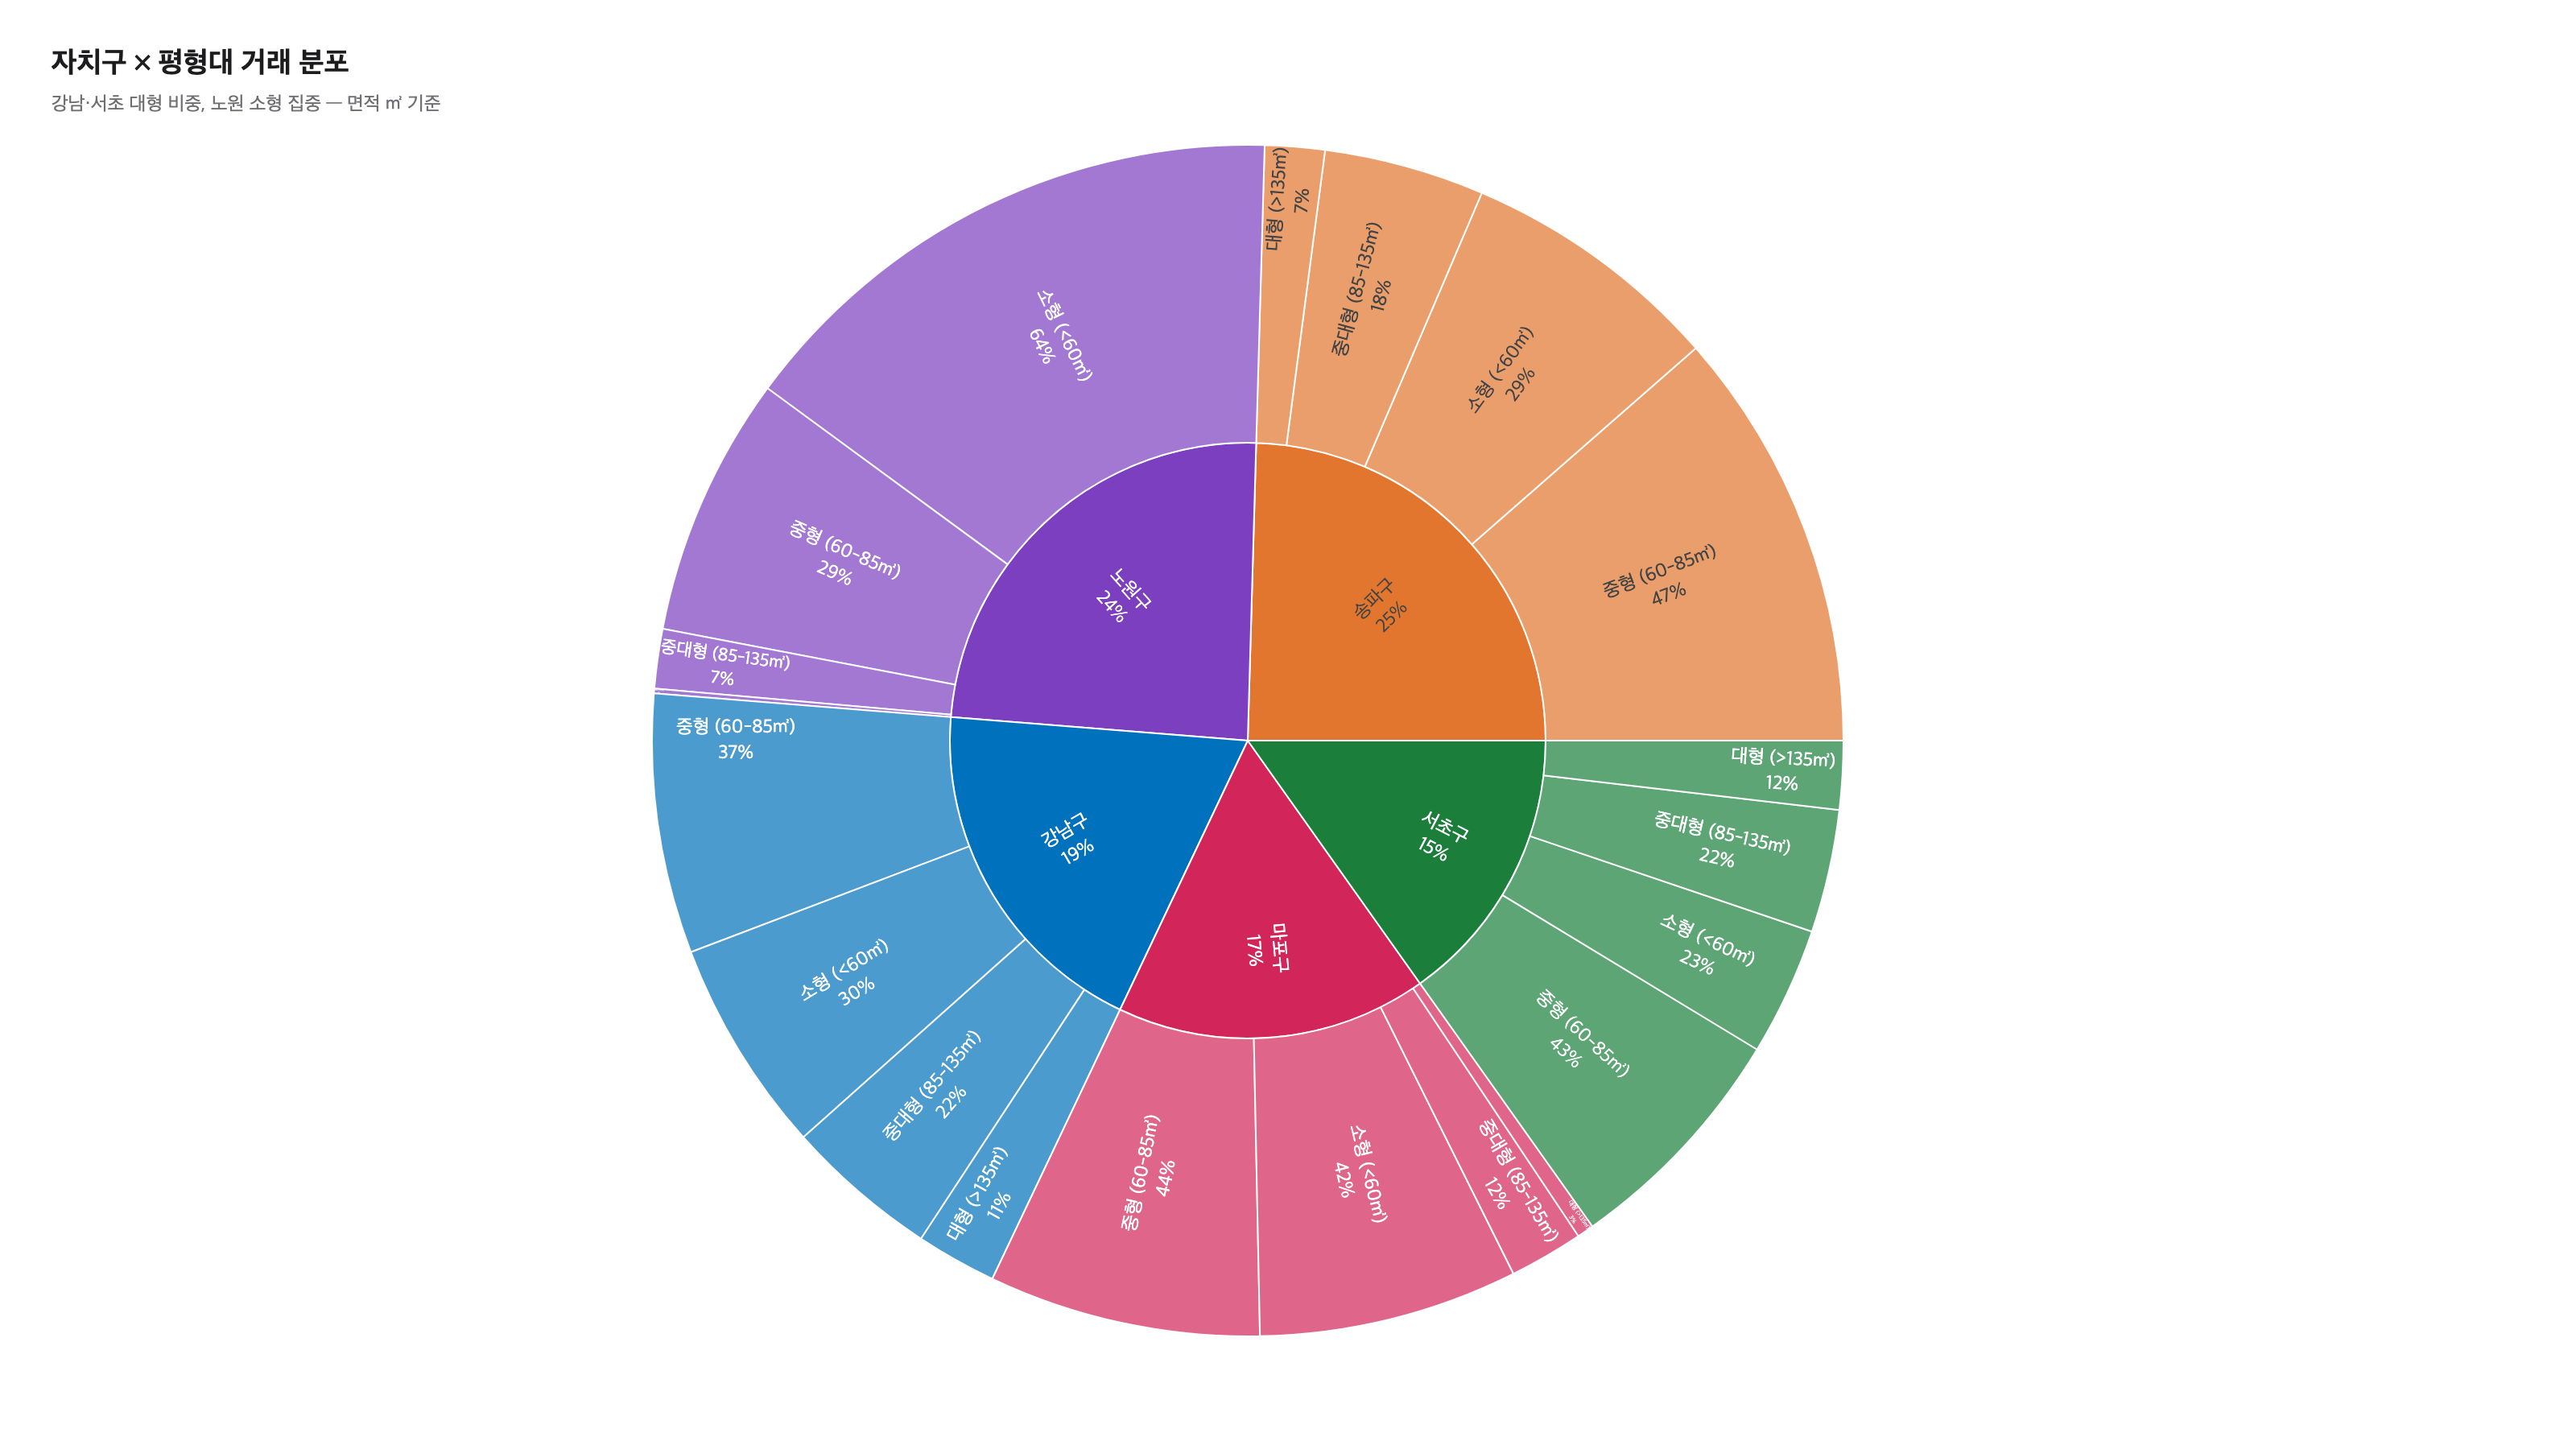
District × size-tier transaction distribution (Sunburst)
Large-unit (>135㎡) share — Seocho 12.3% > Gangnam 11.4% > Songpa 6.6% > Mapo 2.7% > Nowon 0.5%. Small-unit (<60㎡) share — Nowon 63.6% > Mapo 41.7% > Gangnam 30.3% > Songpa 29.0% > Seocho 22.9%. Of Nowon's 9,438 transactions, about 6,000 are small units, while only 1,359 of Seocho's 5,923 are small — the dominant size distribution clearly diverges by district.
Deciding the unit mix for a new sale: a 60~85㎡ mid-size offering in Nowon fits within an existing ~31% market share, whereas a 135㎡+ large offering in Nowon signals a thin buyer pool at a 0.5% market share. Listing recommendation algorithm: the per-district prior distribution can be used directly as a size-weighting parameter. Size distribution is stock information that does not change in the short term — the 24-month analysis can be reused as foundational reference for future material.
CHART C5
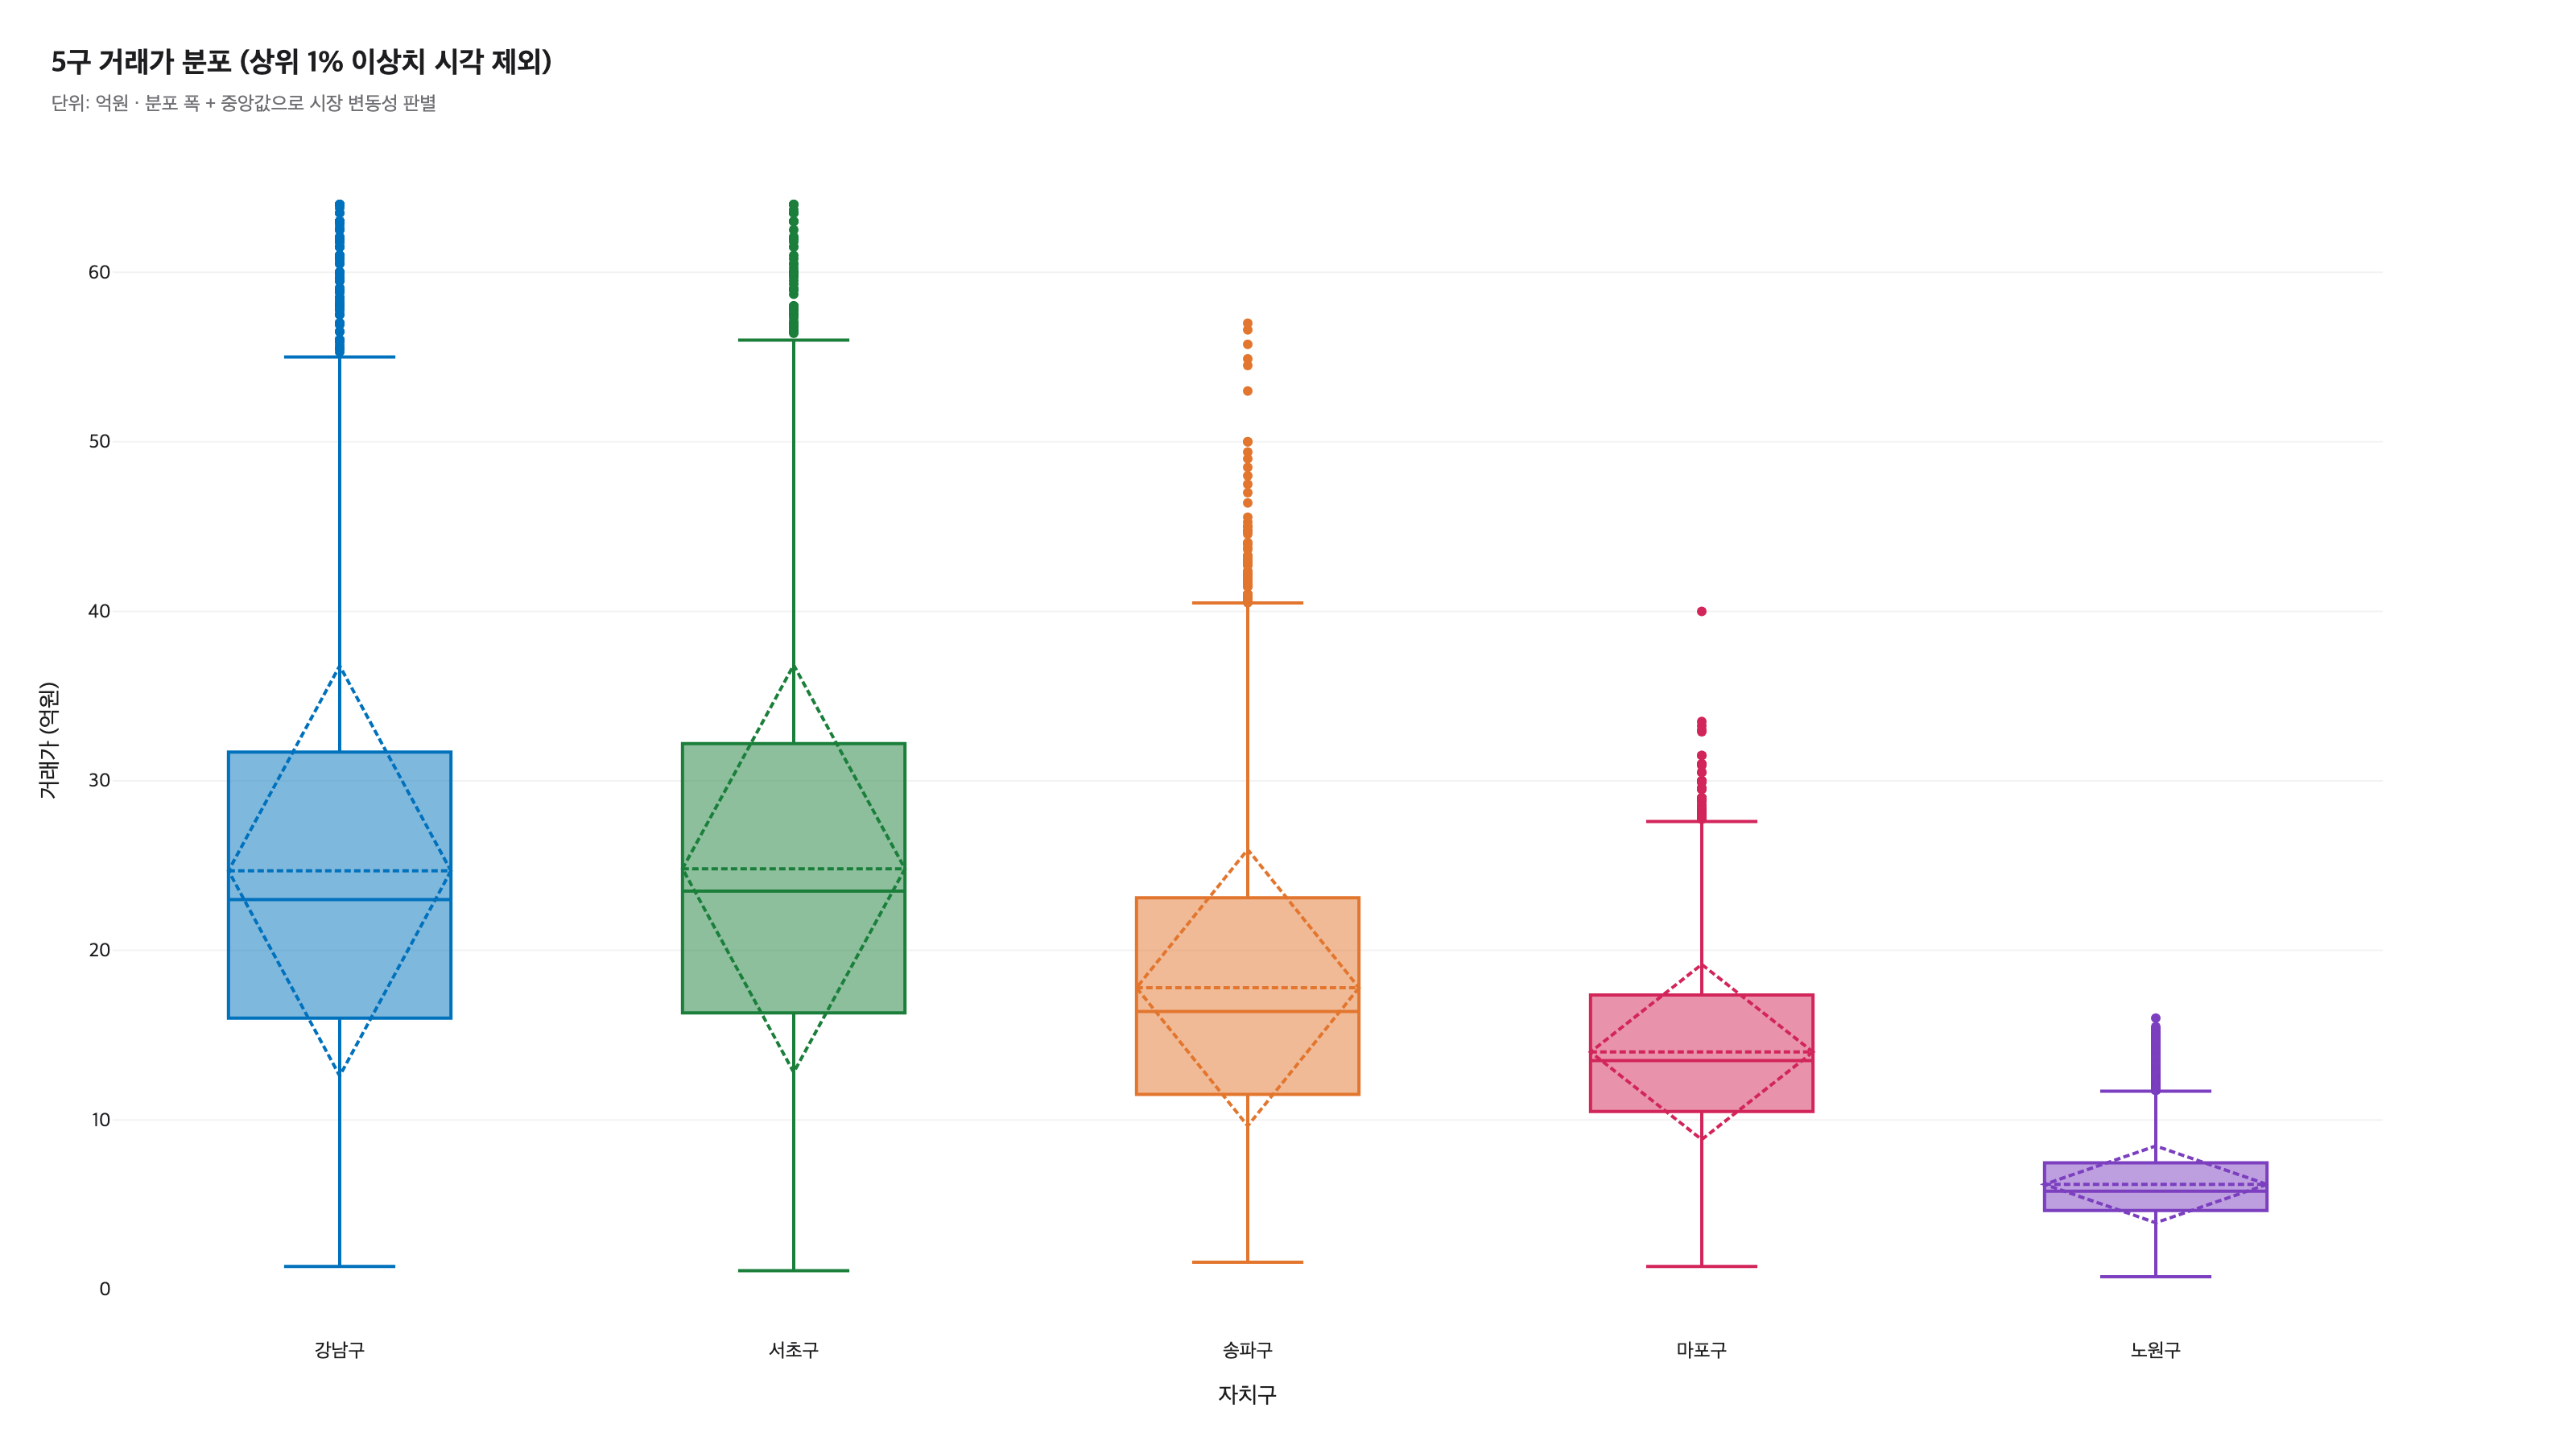
Transaction-price distribution across 5 districts (Box plot, top-1% outliers visually excluded)
Per-district median/IQR comparison · distribution width = market-volatility indicator
▶ Insight C5
Gangnam and Seocho have the widest distributions — within the same district, transactions in the 500M–5B KRW range coexist. Nowon has a narrow distribution, with most concentrated in the 500M–900M central band. Mapo and Songpa sit in the middle between Gangnam and Nowon. Even at the same average price, a narrower distribution means higher price-prediction confidence.
Safety margin for setting sale prices: a Gangnam sale price of 2B ±500M sits within the IQR, while the same ±500M in Nowon is outside it. Price-prediction model oracle: narrow-distribution Nowon is likely to have a lower prediction RMSE. Judging asking-price reasonableness: if a new listing falls outside the district IQR, a negotiation message is prepared in advance. This is an observation point easily missed by analyses that look only at the average price.
CHART C6
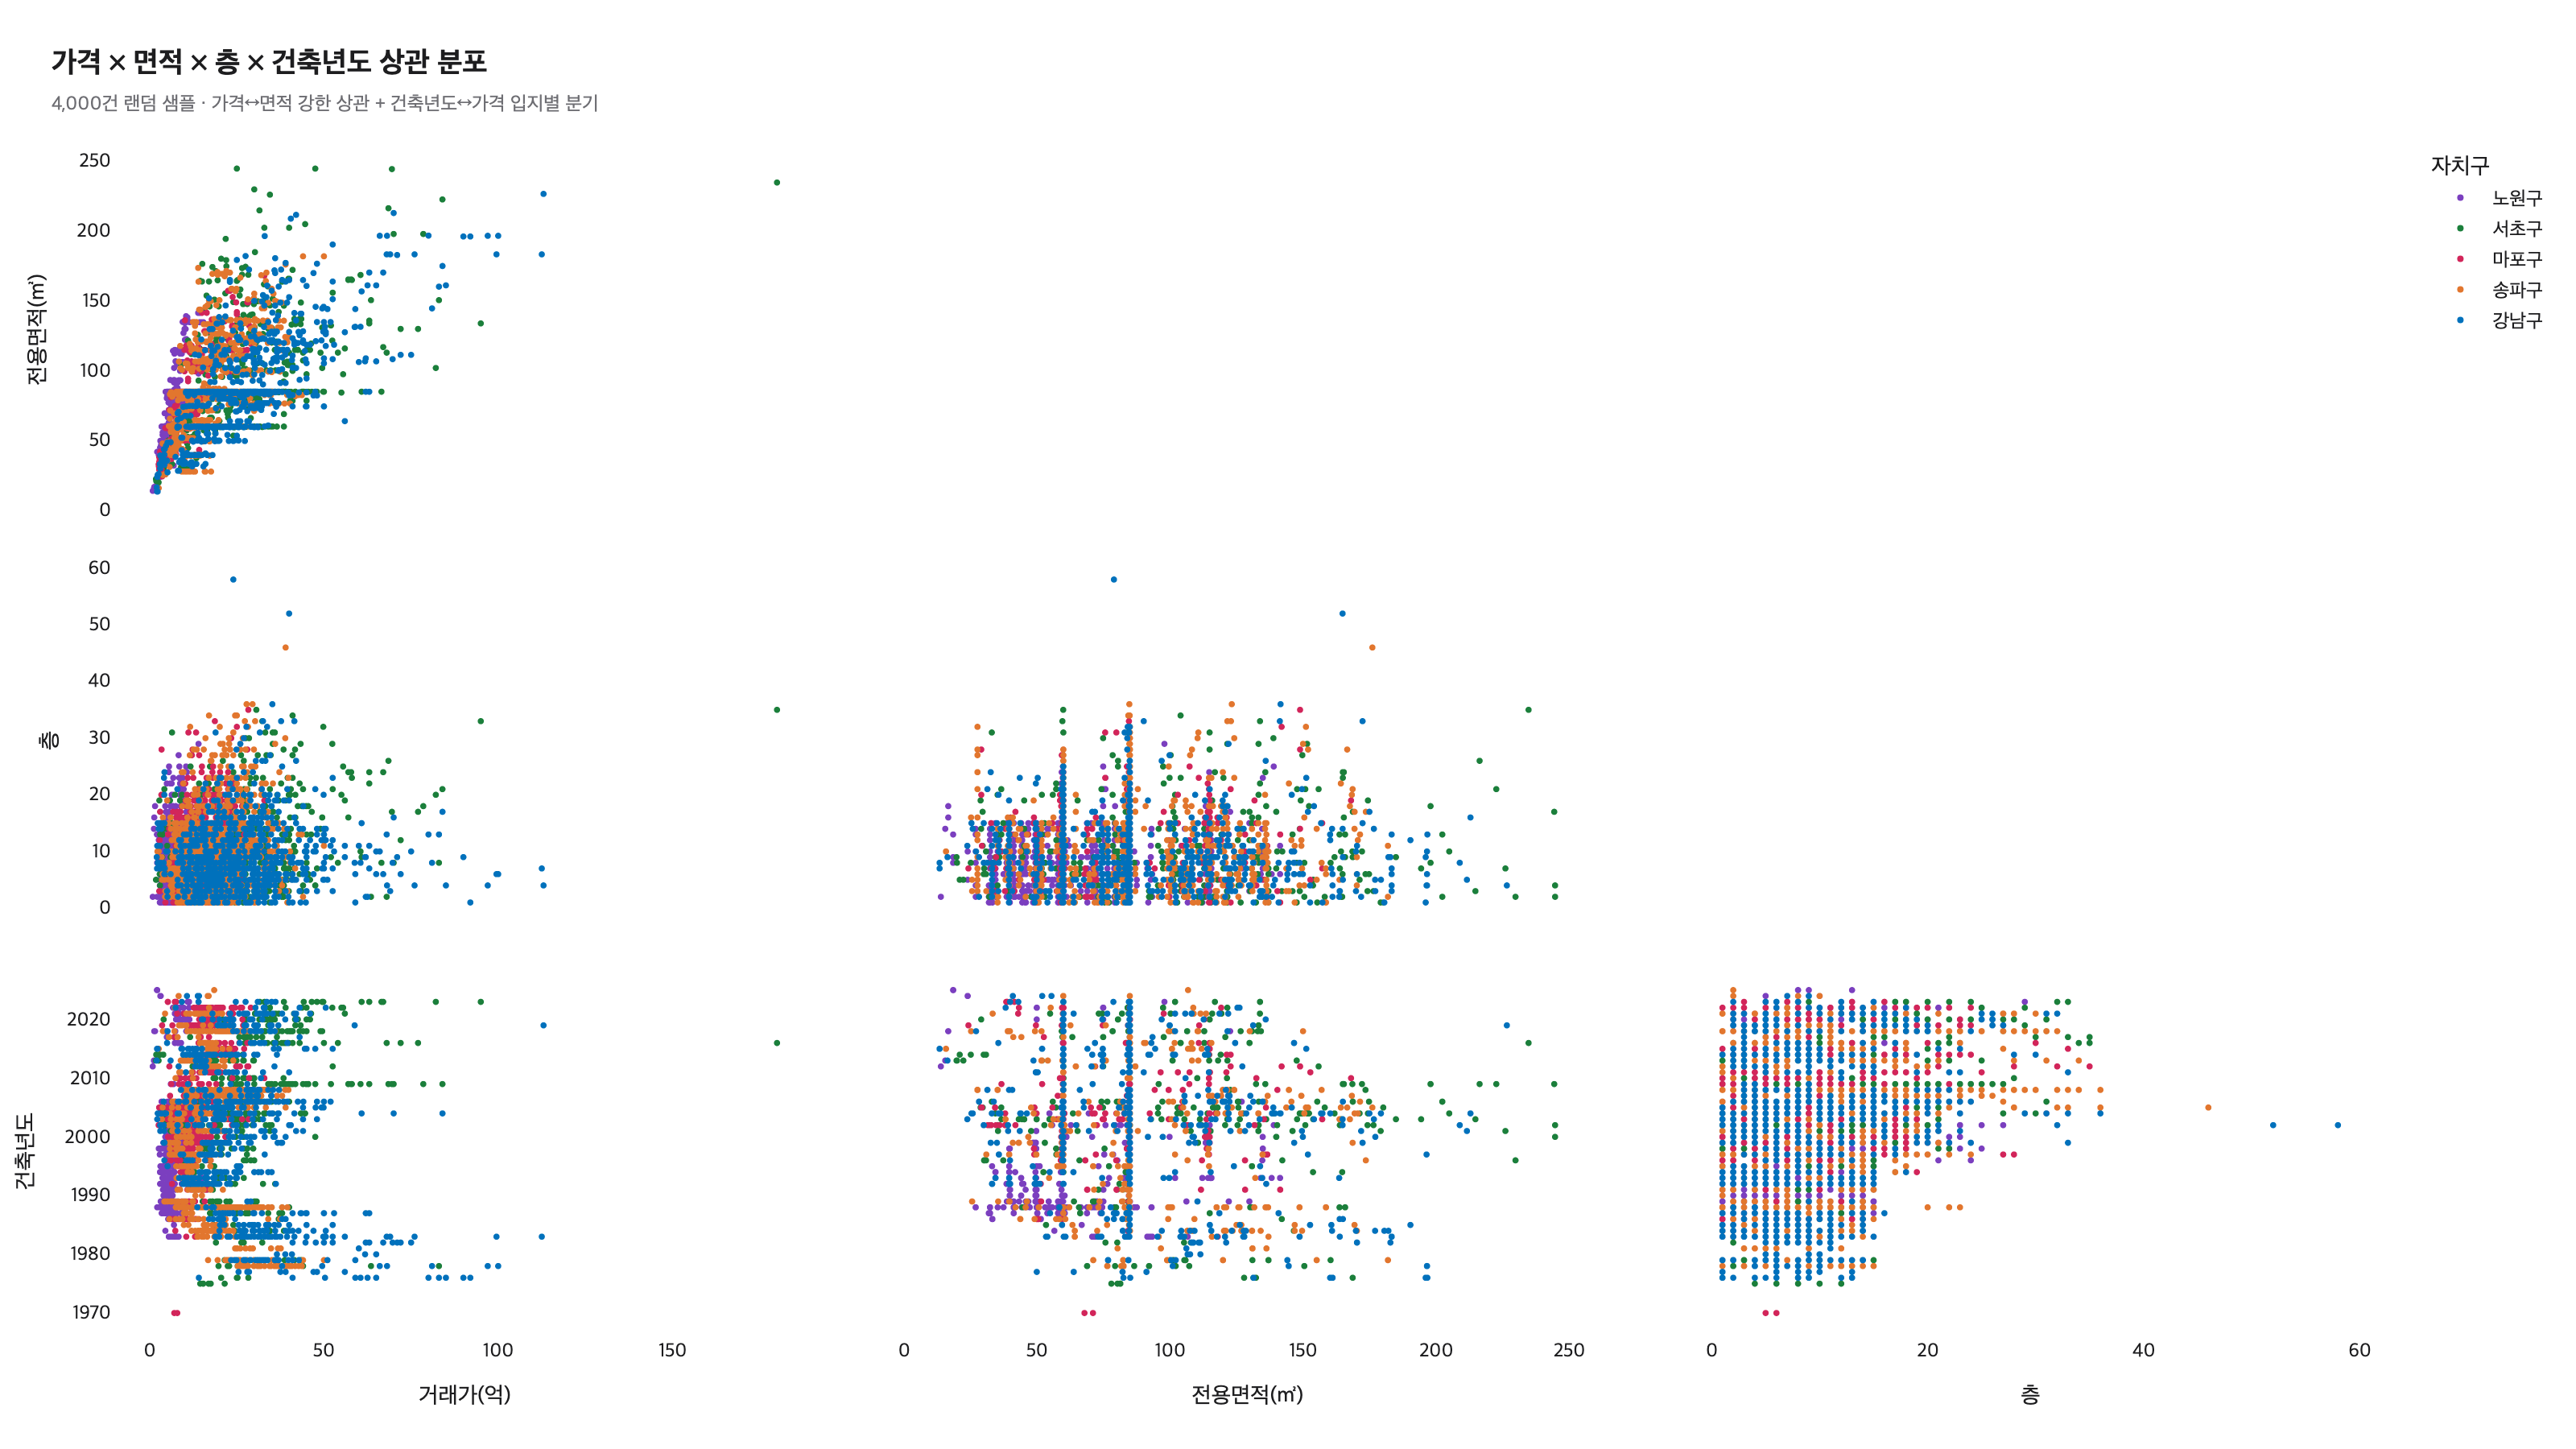
Correlation distribution of price × area × floor × build year (Scatter Matrix · 4,000-record sample)
Per-district Pearson r · the sign of build-year-vs-price diverges by district
▶ Insight C6
Per-district area–price correlation — Nowon 0.799 > Gangnam 0.758 > Mapo 0.573 > Songpa 0.523 > Seocho 0.506. Build-year–price correlation — Mapo +0.475 > Nowon +0.279 > Seocho +0.186 > Songpa −0.087 > Gangnam −0.270. In Gangnam, build year and price are negatively correlated — a pattern where older buildings are on average more expensive (possibly reconstruction expectations or location/complex-composition effects). In Mapo it is +0.475 — a pattern where newer is more expensive. The price-formation structure runs in opposite directions across districts.
Diverging price-prediction models: a single-weight model produces mean-reversion errors on district-mix data. Per-district divergent models achieve higher accuracy. Diverging seller-negotiation messages: for older Gangnam stock, the grounds are "reconstruction potential or location premium"; for newer Mapo stock, "new-build premium." New-sale decisions: an observation point that, for new-build sales in Gangnam/Seocho, the sale price must be set in combination with location and reconstruction expectations.
CHART C7
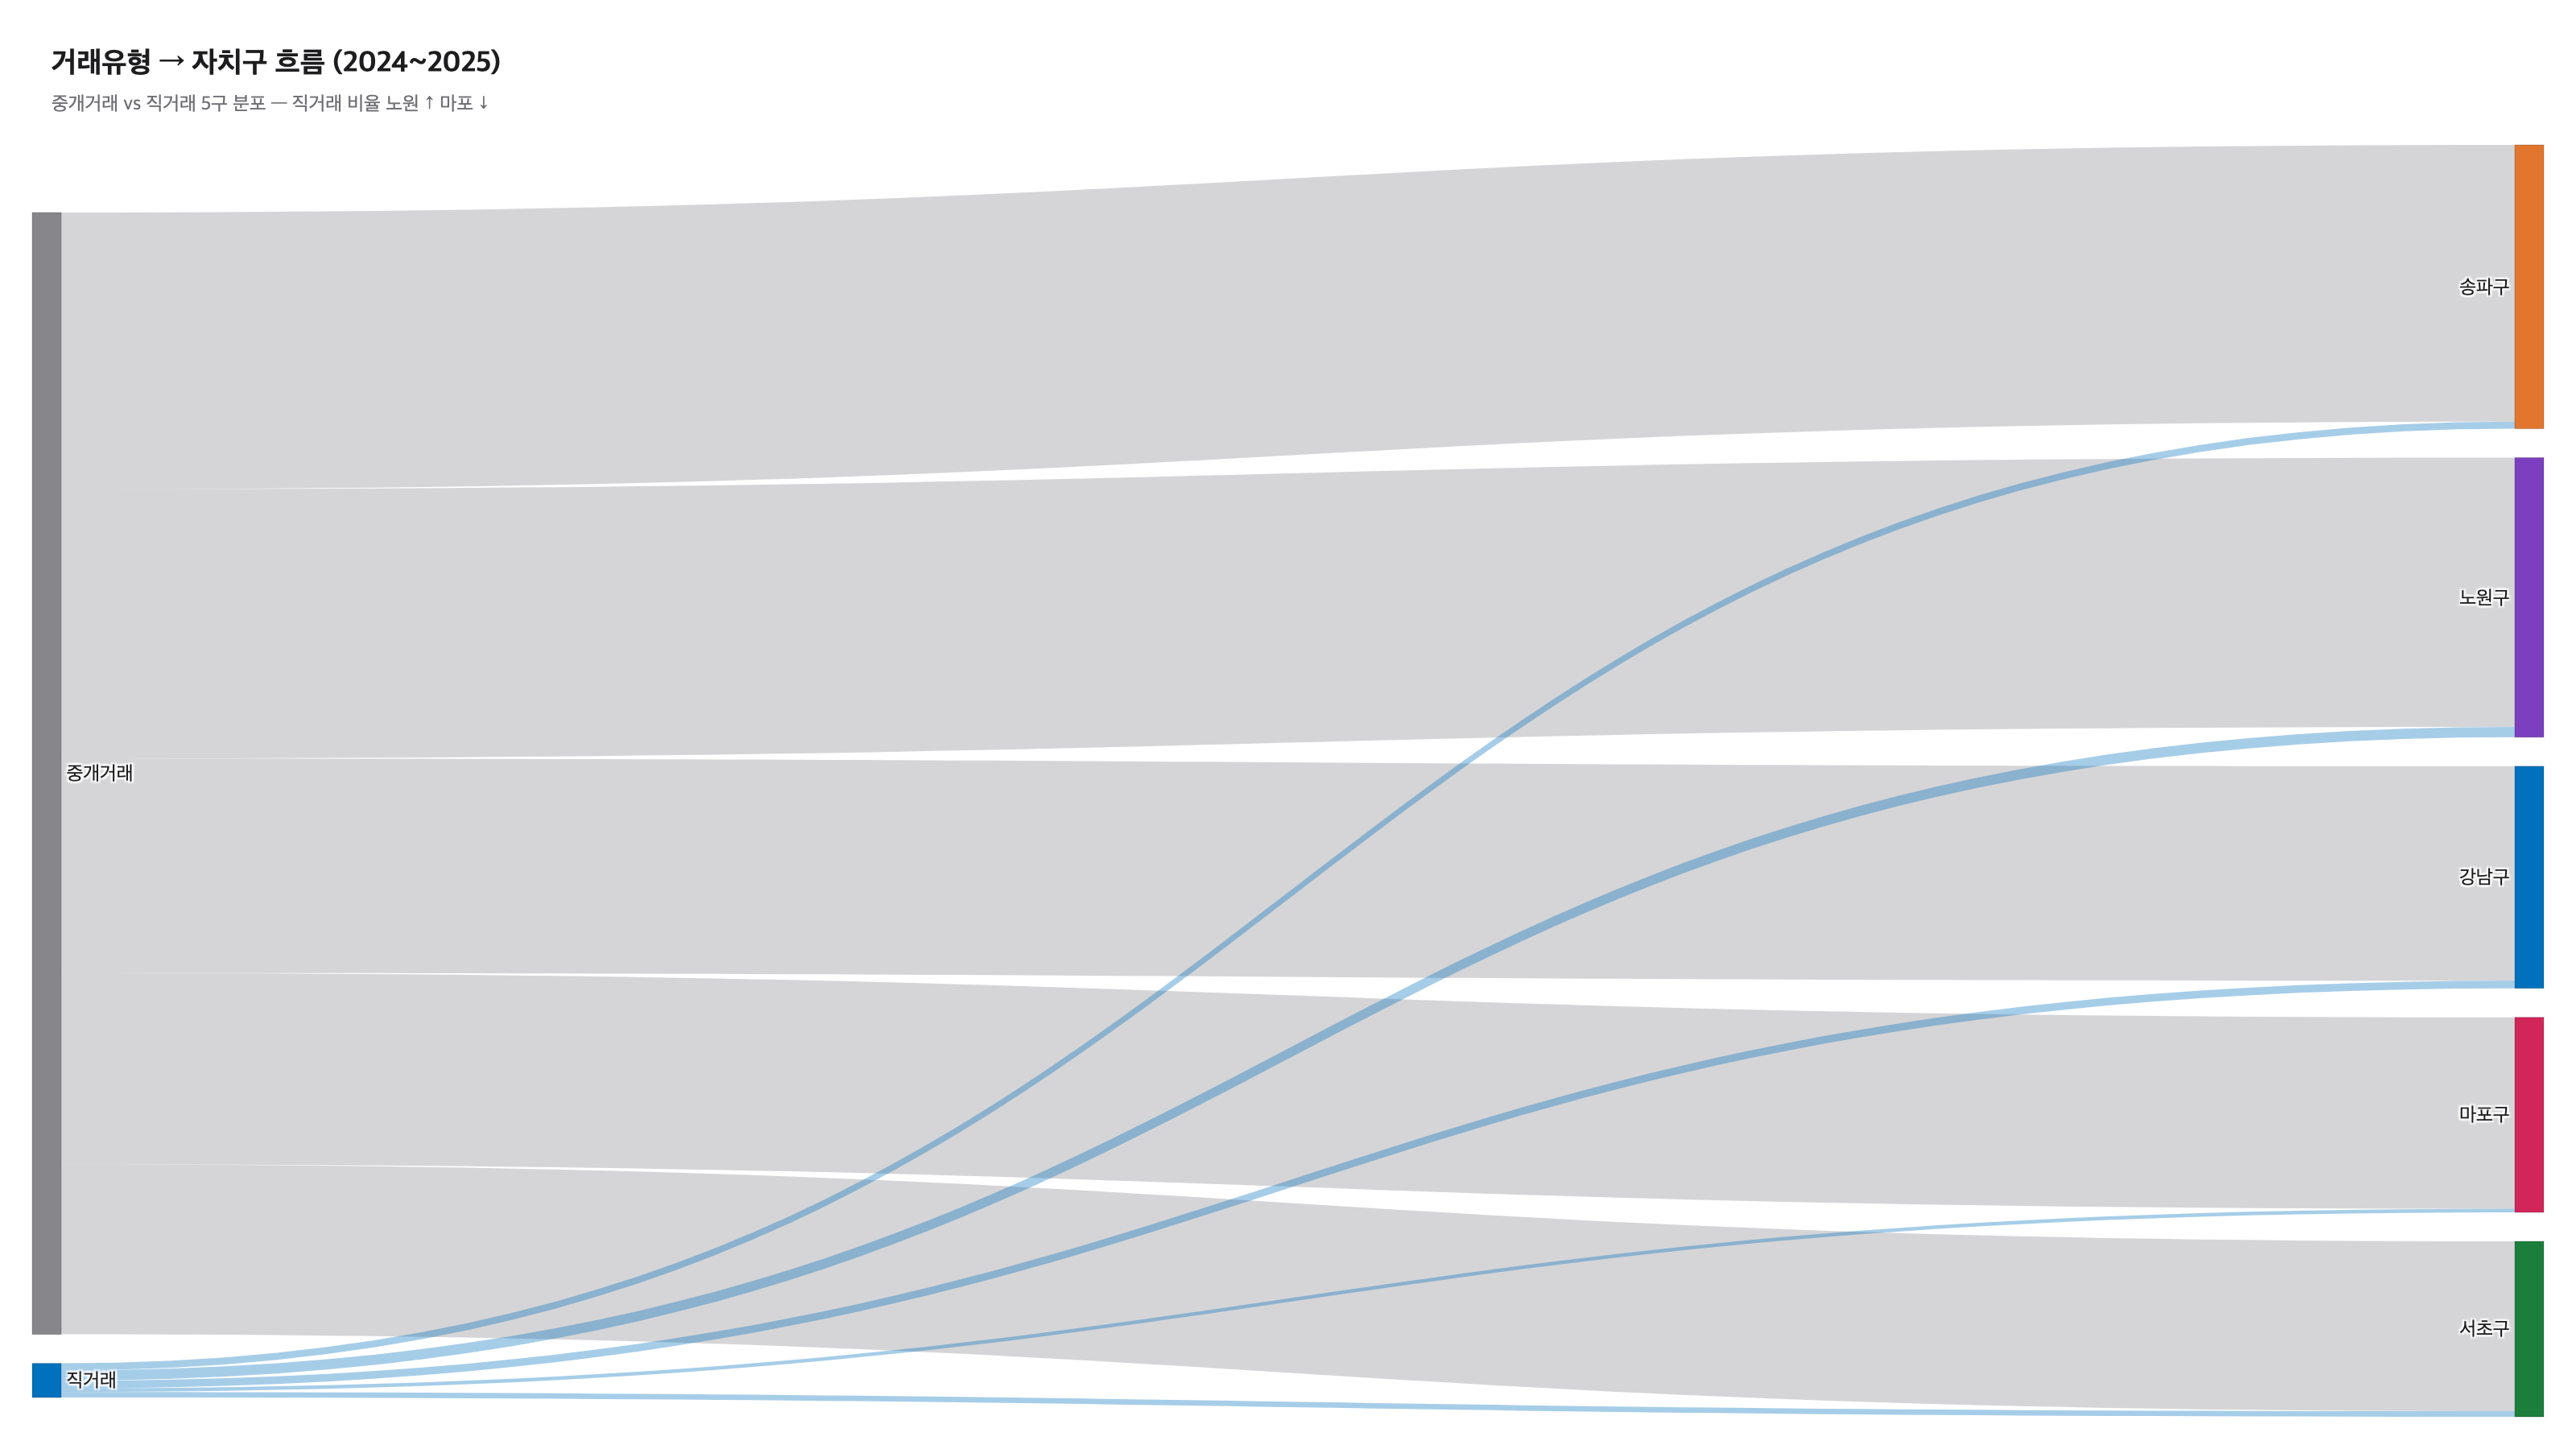
Transaction type → district flow (Sankey)
Brokered vs direct transactions separated · per-district differences in direct-transaction ratio as an operational signal
▶ Insight C7
Of all 39,021 transactions, brokered 37,868 (97.0%) · direct 1,153 (3.0%). Per-district direct-transaction ratio — Nowon 3.69% > Gangnam 3.44% > Seocho 3.16% > Songpa 2.51% > Mapo 1.82%. Diverging from common intuition — intra-family gifting and corporate title transfers in older outlying complexes may be a factor. The actual measurement puts Nowon first, at 2.0× Mapo. Direct transactions may include non-standard flows such as intra-family gifting, intra-corporate transfers, and trusts, so per-district differences register as an operational signal.
Separating the market-average-price calculation: filter with dealingGbn == 'direct' to isolate the "normal market price." Cautious use as a sale-price reference: districts with a high direct-transaction ratio can produce a flow where intra-family deals have little effect on the market price, so use them cautiously as a sale-price reference. Checking sales penetration: a district with a high direct-transaction ratio (Nowon) signals many transactions outside your own sales network — check for listing-information asymmetry. Because the 24-month cumulative pattern is stable, re-measuring this chart when policy changes (e.g. tighter gift tax) lets you quantify the market impact.
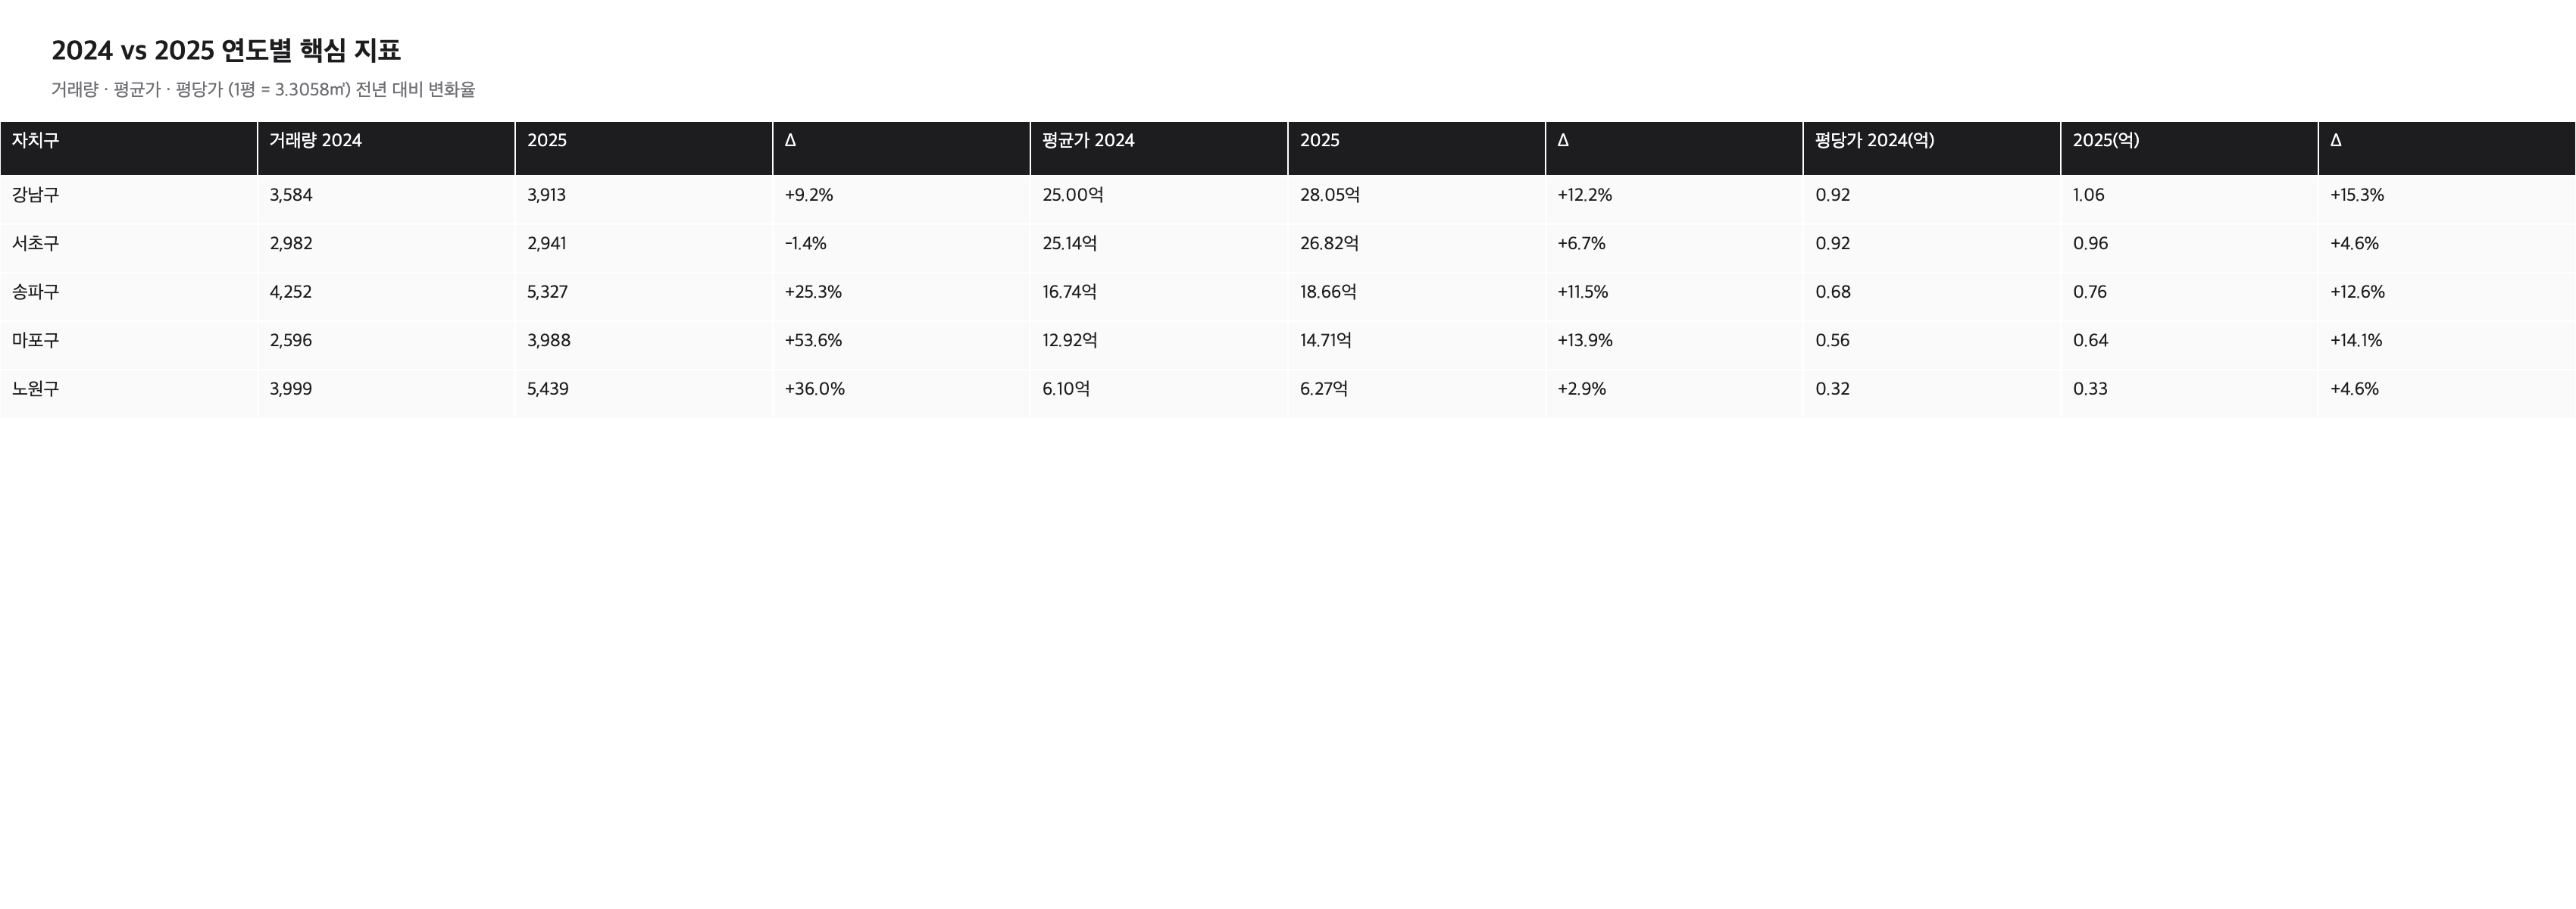
CHART C8
2024 vs 2025 yearly key-metric summary (KPI Cards)
5 districts × 4 metrics × 2 years in one table · a standard format for board and executive reporting
▶ Insight C8
Volume change — Mapo +53.6%, Nowon +36.0%, Songpa +25.3%, Gangnam +9.2%, Seocho −1.4%. Average-price change — Mapo +13.9%, Gangnam +12.2%, Songpa +11.5%, Seocho +6.7%, Nowon +2.9%. Price per pyeong (10,000 KRW/pyeong) — Gangnam 9,160 → 10,559 (+15.3%), Mapo 5,639 → 6,437 (+14.1%), Songpa 6,755 → 7,608 (+12.6%), Seocho 9,191 → 9,617 (+4.6%), Nowon 3,189 → 3,336 (+4.6%). Volume growth and price growth diverge — Mapo rose on both at +53.6% volume and +13.9% price, while Seocho stalled at −1.4% volume.
A one-slide board summary: a simultaneous 5-district comparison in the form "2024–2025: Mapo/Songpa volume ↑ + price ↑ rising together, Gangnam price ↑ with volume moderate, Seocho volume stalled." Reallocating sales resources: add headcount in districts with rising volume + price (Mapo, Songpa), and shift districts with stalled volume (Seocho) toward securing listing supply. Tracking separately along the two axes (volume vs price) is a starting point for identifying the market phase (recovery, expansion, plateau, correction).
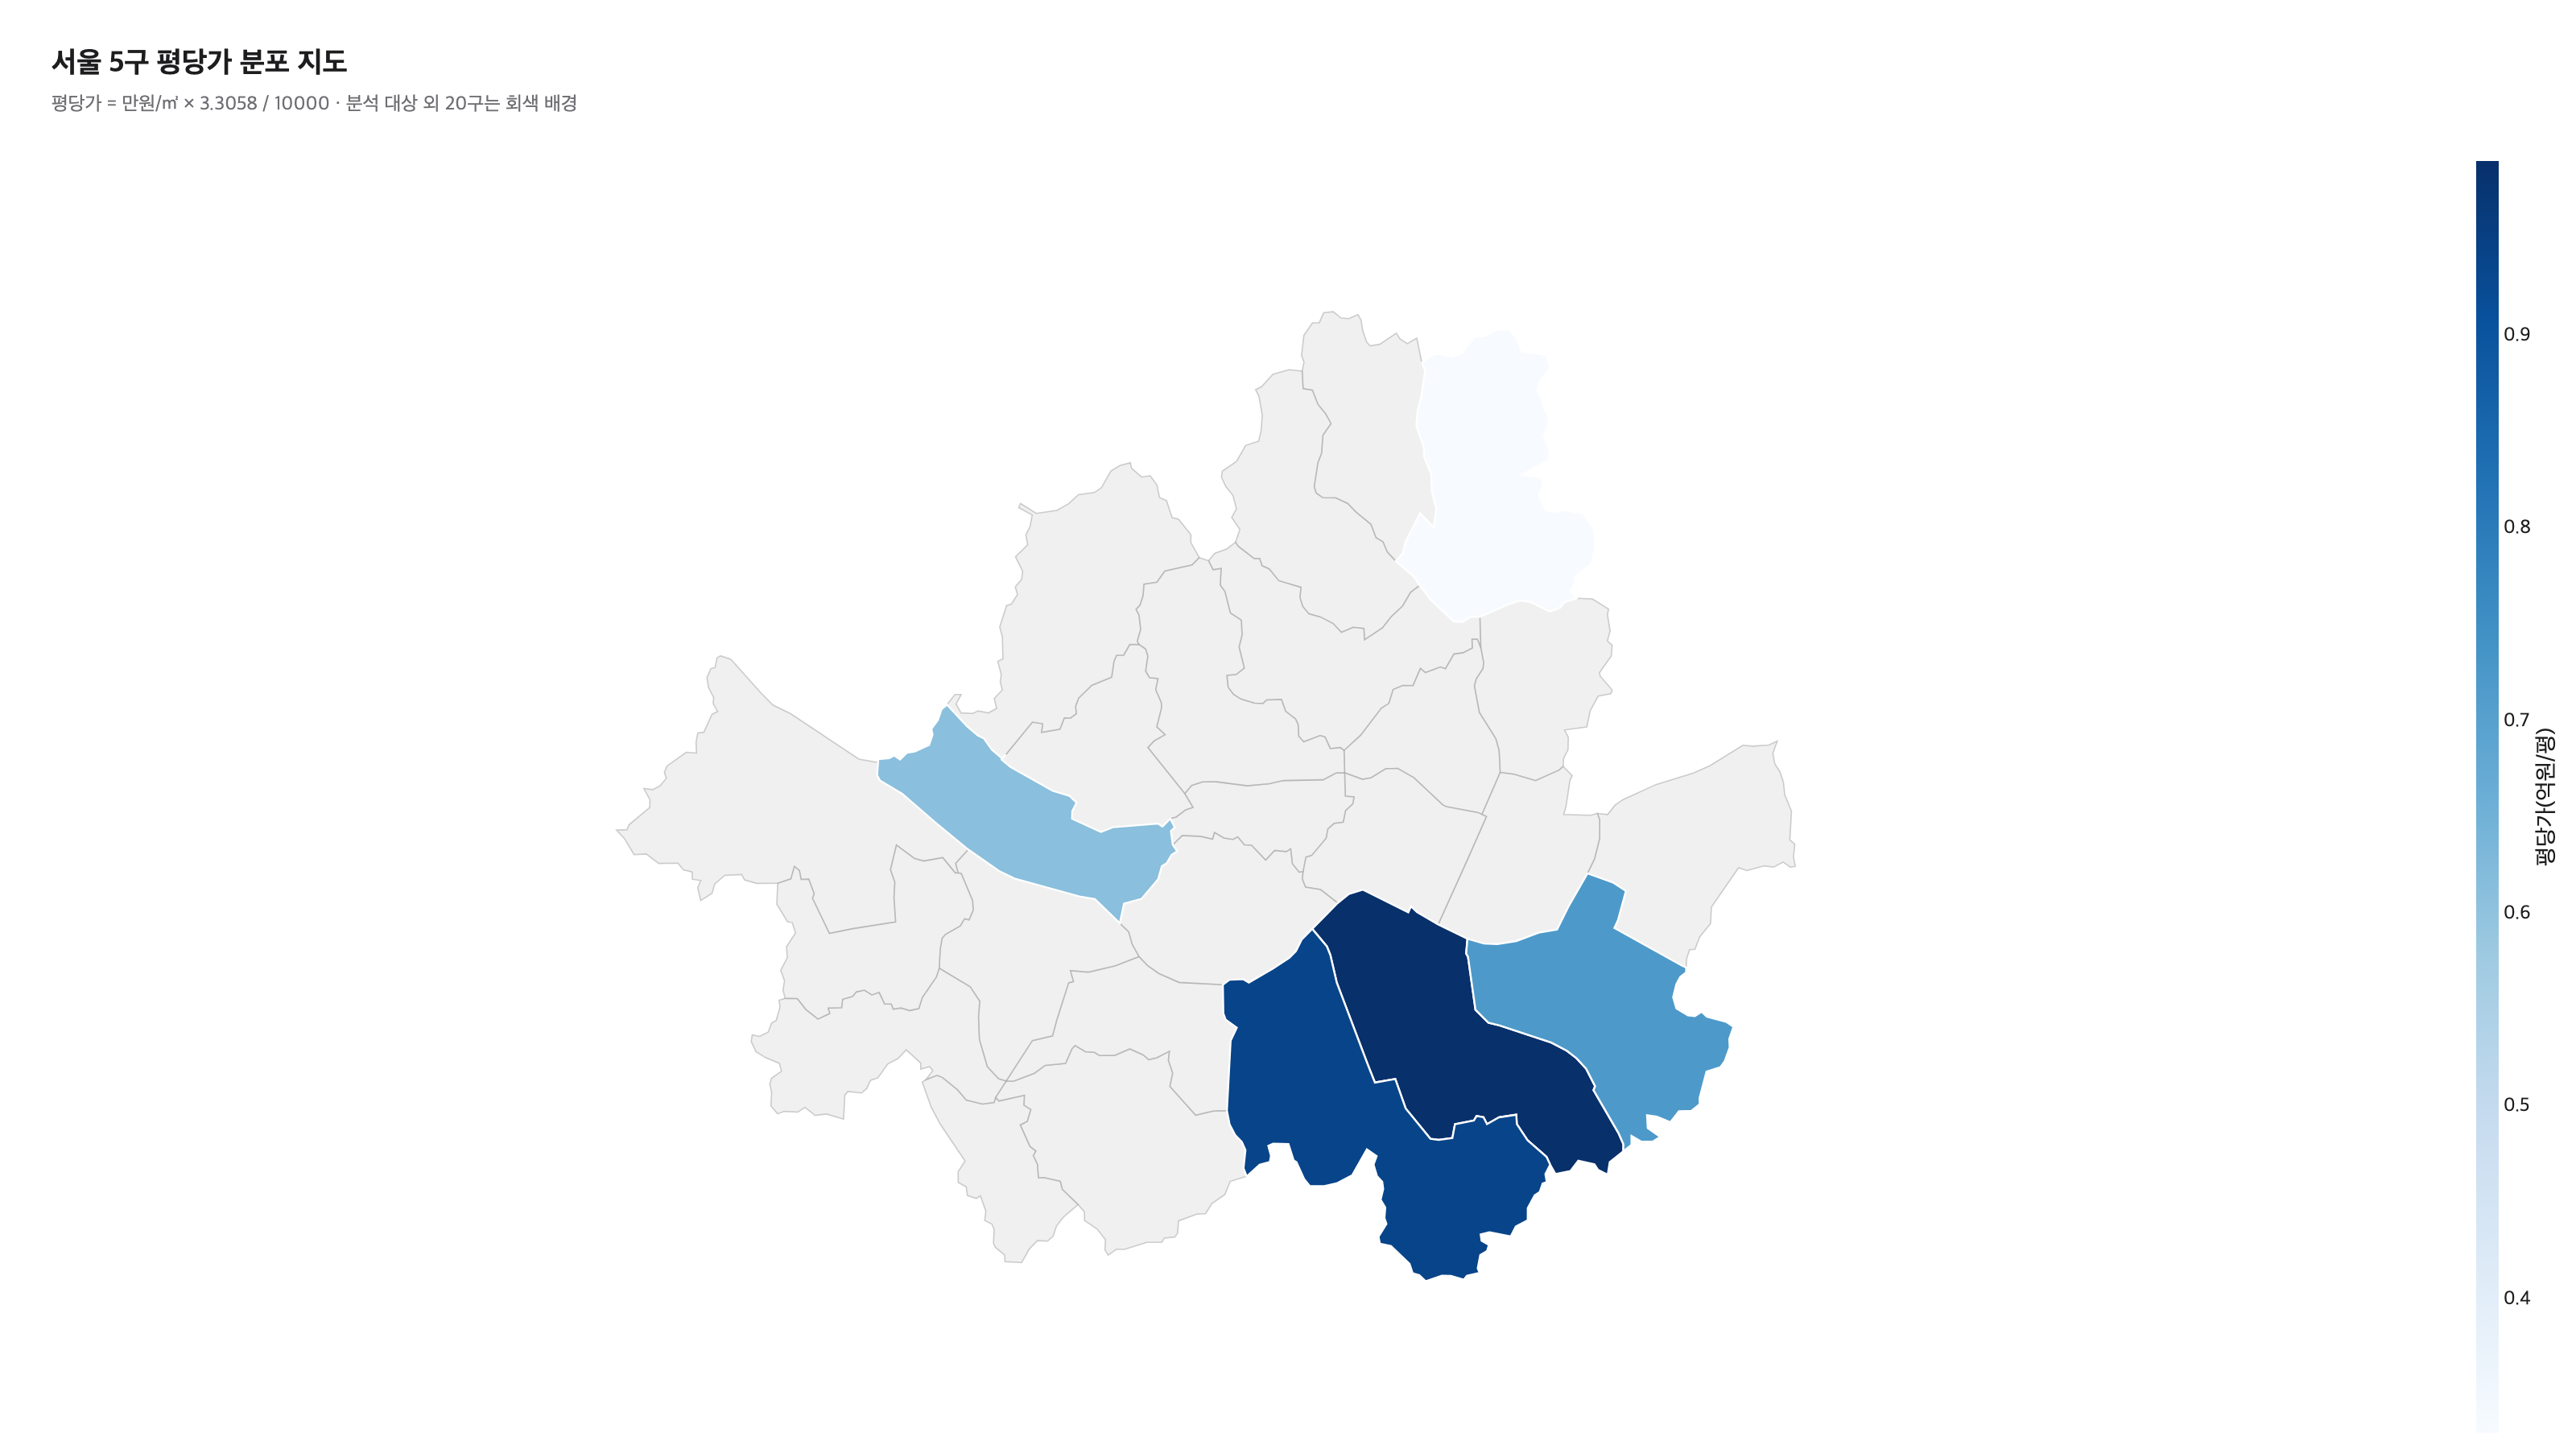
MAP M1
Price-per-pyeong distribution map across 5 Seoul districts (Choropleth)
24-month average price per pyeong (10,000 KRW/pyeong) · administrative-district GeoJSON mapping · the other 20 districts shown in gray
▶ Insight M1
24-month average price per pyeong (10,000 KRW/pyeong) for the 5 districts — Gangnam-gu 9,890 > Seocho-gu 9,402 > Songpa-gu 7,230 > Mapo-gu 6,122 > Nowon-gu 3,274. A 3.02× gap between Gangnam and Nowon. The map shows the spatial relationship in one view: the Gangnam/Seocho cluster south of the Han River + Mapo north of the river + Nowon in the northeast.
Site-review report: inserting this single map uses the price-per-pyeong gap between adjacent districts to explain market position in IR material. Reusing the GeoJSON mapping: this case's SIG_CD-code-based district metadata can be reused as-is in an operational environment. New-branch location negotiation: convert the price-per-pyeong gap between adjacent districts into a "districts with inbound customer potential" message. The absolute price per pyeong rose in every district across 24 months, while the relative ranking among districts stayed stable — location premium is foundational reference that does not waver in the short term.
§ 4. Function Library & Handoff
A declarative interface that lets non-specialists add charts
Once a function is pre-registered per chart type, adding a new chart is done with a single function call or
one YAML block.
The library manages the design system — layout, color, fonts — while the domain expert focuses solely on the data and axis mapping.
Code sample — declarative chart API
fromcharts_libimportrender_line, render_bar_horizontal, render_sunburst, render_chloropleth# function name is render_chloropleth (legacy alias)# Monthly average transaction price trend by district — reproduce the C1 chart in one linerender_line(
df,
x="month",
y="avg_price_eok",
group="district_name",
title="District Price Trend (24 months)",
highlight="마포구",
)
# District × size-tier distribution — the same pattern as the C4 chartrender_sunburst(
df,
path=["district_name", "size_bucket"],
value="trade_count",
title="District × Size Mix",
)
# District price-per-pyeong map — M1 GeoJSON mappingrender_chloropleth(
df,
location_col="sig_cd",
value="price_per_pyeong_manwon",
geojson="data/seoul_districts.geojson",
focus_codes=["11680", "11650", "11710", "11440", "11350"],
)
→ When you run uv run python scripts/dashboard_runner.py,
schema validation (column/function existence · anonymization policy) → chart rendering → an audit log (audit_log.jsonl)
records config_hash · data_hash · rows · timestamp — securing reproducibility and auditability.
📘 Handoff manual excerpt
"To add a new chart, add a new section to dashboard.yaml.
Under chart:, write a predefined function name (render_line · render_bar_horizontal · render_sunburst · render_chloropleth, etc.),
and under params:, map the column names.
Typos, nonexistent columns, and anonymization violations are blocked with actionable errors in schema validation.
Charts can be added, removed, and reconfigured without code changes, and adding a new district is done by registering a single SIG_CD code."
Interactive dashboard — live demo
When the district, transaction-type, or size-tier filters change, four charts — the M1 map · the C1 trend · the C7 flow · the C8 KPIs — update reactively at once.
Sales reports, internal POC meetings, and in-house operational reporting are all handled in the same interface.
(A static frame in PDF; for live behavior, see the case study HTML or the plic-portfolio page)
This case study's scope vs. what's additionally provided in a real project
✓ This case study (portfolio scope)
39,021 actual measured records from the Public Data Portal (no usage-license restrictions) · 9 charts · function library · YAML loader · audit log · schema validation · single-page HTML · complex-name masking + dong/unit precision limit
+ Additionally provided in a real project
Direct DB integration (PostgreSQL + sqlalchemy) · LDAP/SAML access management · Docker compose deployment · automated PDF/Excel export · monthly/quarterly refresh automation · pytest coverage · operations manual · expansion to all 25 districts + integration of external data (official land prices, population)
§ 5. Summary & Next Steps
PLIC Studio's real estate data analysis capabilities, in summary
This case study demonstrates the work of connecting KOGL Type 1 public data into per-district visualizations + domain-application messages.
Each chart comes with both an actual measured pattern and a domain-application message, and the function library, YAML config, and audit log all actually work. The anonymization policy is enforced in schema validation. Per-audience use cases are summarized separately in the § 5 use-case examples box.
39,021 actual measured records + 9 charts + GeoJSON mapping — including cases that diverge from common intuition (the direct-transaction ratio is 2× higher in outlying Nowon than in Mapo)
Diverging per-district price-formation structures (a pattern where older stock is more expensive in Gangnam vs a new-build premium in Mapo) — a starting point for avoiding a single model in favor of per-district divergent models
Mapo 2024→2025 volume +53.6% / average price +13.9% rising together — organizing the two axes for identifying the market phase
Saturday's 24.7% contract-date concentration — verified stable over 24 months as a fixed input for sales and operations
The spatial structure of the 3.02× price-per-pyeong gap between Gangnam and Nowon — foundational reference for site review and location negotiation
Use-case examples (3 audience perspectives)
Here is how the same analysis asset combines into different use cases depending on the audience, organized as 3 segment examples. The actual project SCOPE varies with the audience mix.
SCOPE 1
Developer IR · sales report
Sale-price simulation + 24-month trend of benchmark districts + unit-mix market share + a one-slide board summary (directly citing C1 · C4 · C8 · M1). Sales-launch timing decision material for executive reporting.
SCOPE 2
PropTech CTO · porting the data environment
Port the per-district divergent model + GeoJSON mapping + audit_log pattern + anonymization schema validation into your own environment as-is. A flow for the internal analytics team to extend its technical assets.
SCOPE 3
Brokerage head of division · sales-network operations
Use volume, size distribution, direct-transaction ratio, and weekday patterns as a starting point for sales-network operations. The basis for staffing + office hours + listing-supply analysis decisions.
Direct MOLIT Open API integration + monthly/quarterly batch auto-refresh + 5-district → 25-district expansion + integration of external data (official land prices, population, transit).
※ The function library + YAML config + anonymization policy + audit log pattern are applied consistently across all 4 deliverables above.
Additionally provided in a real project: access management (LDAP/SAML integration) · intranet deployment (Docker compose / on-prem) ·
config/data/chart version tracking (execution logs for reproducibility verification + git integration) ·
automatic reporting-lag cut per §3 of the Real Estate Transaction Reporting Act · a pipeline integrating external data (official land prices · population · transit).
Standard schedule & quote: based on the 25–30 working-day timeline agreed on the call. After reviewing the SCOPE 1–4 combination and the actual data and environment, a formal quote will be sent separately.
Next Case Study preview
CASE 03 E-commerce sales & customer behavior analysis (RFM segmentation)
CASE 04 Visualizing financial metrics of Korean listed companies (DART API)
Request a data analysis
Real estate · finance · public sector · e-commerce · healthcare and more — domain-agnostic. We can do standards-aligned work such as Public Data Portal licensing and CPMI-IOSCO.